Main features
- Easy integration into existing analysis pipelines in R for programmatic dashboard creation
- Provides a selection of predefined layouts to arrange content
- Support for multiple components, such as htmlwidgets, tables, text, images etc.
- Creation of web-based, sharable, static or interactive dashboards
- Enables a flexible and iterative cycle of dashboard development

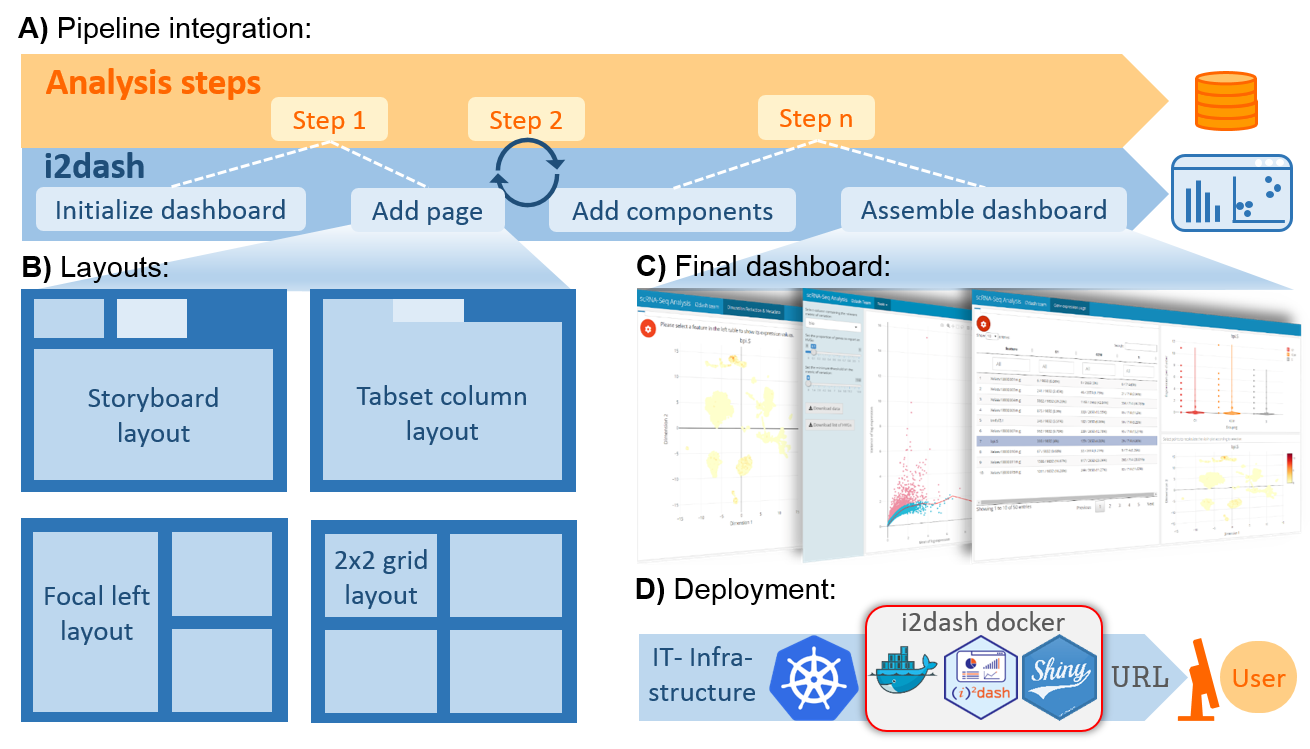
(A) dashboard is initialized at the beginning of a data analysis pipeline. During the pipeline run, new content, results, or data visualizations are iteratively added to the dashboard’s pages. The final dashboard is rendered into a static or interactive document. (B) Pages added to the dashboard can be arranged in a flexible manner from a selection of predefined layouts. (C) Examples of programmatically created dashboards. (D) The i2dash docker container, providing all dependencies for interactive, shiny based apps, can be used to easily deploy individual data interpretations on a cloud infrastructure, such as Kubernetes, as a micro service.
