Plotting
Loading example data
# Import the plotting module
import sctoolbox.plotting as pl

# Load example dataset
import numpy as np
np.random.seed(42)
import scanpy as sc

adata = sc.datasets.pbmc68k_reduced()
adata.obs["condition"] = np.random.choice(["C1", "C2", "C3"], size=adata.shape[0])
qc_filter
Functions for plotting QC-related figures e.g. number of cells per group and violins.
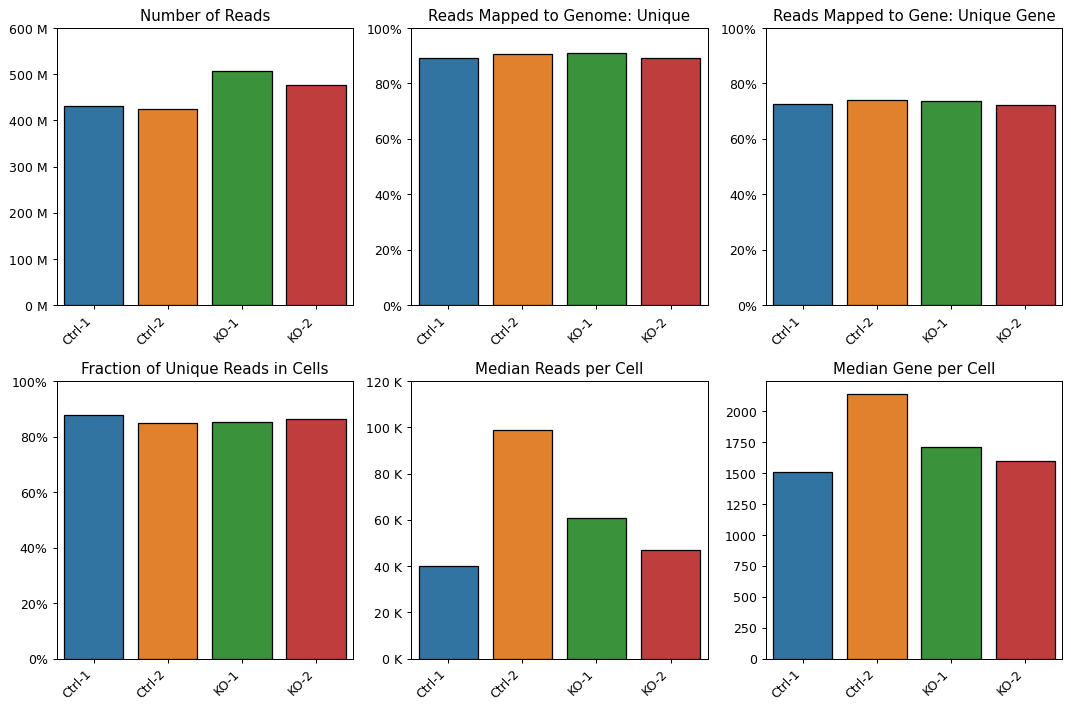
- sctoolbox.plotting.qc_filter.plot_starsolo_quality(folder: str, measures: list[str] = ['Number of Reads', 'Reads Mapped to Genome: Unique', 'Reads Mapped to Gene: Unique Gene', 'Fraction of Unique Reads in Cells', 'Median Reads per Cell', 'Median Gene per Cell'], ncol: int = 3, order: list[str] | None = None, save: str | None = None, **kwargs: Any) ndarray[source]
Plot quality measures from starsolo as barplots per condition.
- Parameters:
folder (str) – Path to a folder, e.g. “path/to/starsolo_output”, which contains folders “solorun1”, “solorun2”, etc.
measures (list[str], default ["Number of Reads", "Reads Mapped to Genome: Unique", "Reads Mapped to Gene: Unique Gene", "Fraction of Unique Reads in Cells", "Median Reads per Cell", "Median Gene per Cell"]) – List of measures to plot. Must be available in the solo summary table.
ncol (int, default 3) – Number of columns in the plot.
order (Optional[list[str]], default None) – Order of conditions in the plot. If None, the order is alphabetical.
save (Optional[str], default None) – Path to save the plot. If None, the plot is not saved.
**kwargs (Any) – Additional arguments passed to seaborn.barplot.
- Returns:
axes – Array of axes objects containing the plot(s).
- Return type:
np.ndarray
- Raises:
KeyError – If a measure is not available in the solo summary table.
Examples
pl.plot_starsolo_quality("data/quant/")
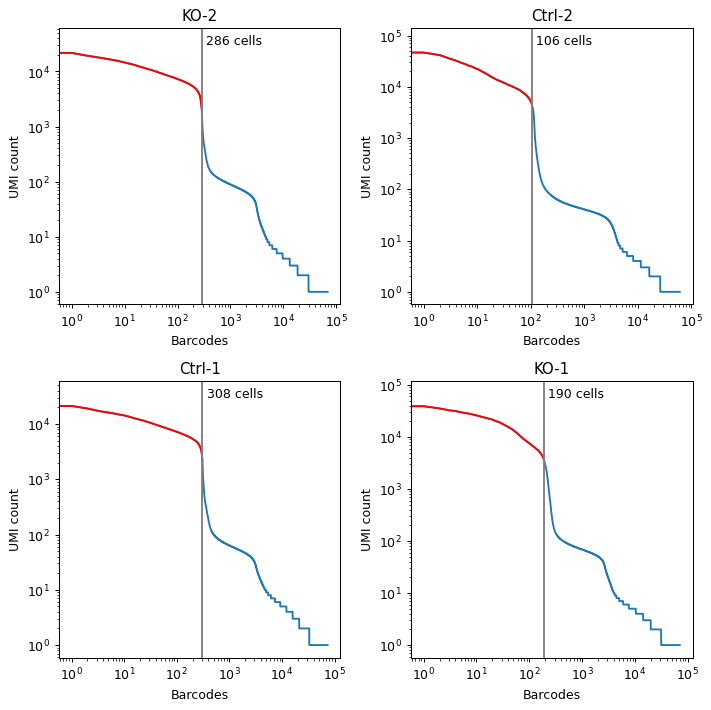
- sctoolbox.plotting.qc_filter.plot_starsolo_UMI(folder: str, ncol: int = 3, save: str | None = None) ndarray[source]
Plot UMI distribution for each condition in a folder.
- Parameters:
folder (str) – Path to a folder, e.g. “path/to/starsolo_output”, which contains folders “solorun1”, “solorun2”, etc.
ncol (int, default 3) – Number of columns in the plot.
save (Optional[str], default None) – Path to save the plot. If None, the plot is not saved.
- Returns:
axes – Array of axes objects containing the plot(s).
- Return type:
np.ndarray
- Raises:
ValueError – If no UMI files (‘UMIperCellSorted.txt’) are found in the folder.
Examples
pl.plot_starsolo_UMI("data/quant/", ncol=2)
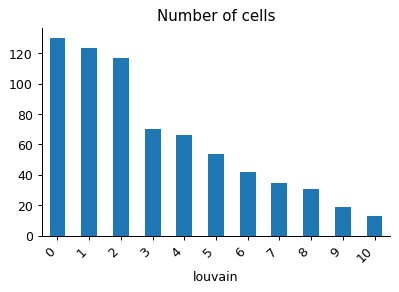
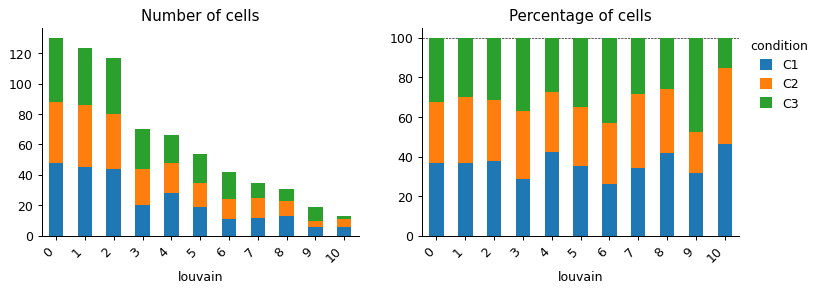
- sctoolbox.plotting.qc_filter.n_cells_barplot(adata: AnnData, x: str, groupby: str | None = None, stacked: bool = True, save: str | None = None, figsize: tuple[int | float, int | float] | None = None, add_labels: bool = False, **kwargs: Any) Iterable[Axes][source]
Plot number and percentage of cells per group in a barplot.
- Parameters:
adata (sc.AnnData) – Annotated data matrix object.
x (str) – Name of the column in adata.obs to group by on the x axis.
groupby (Optional[str], default None) – Name of the column in adata.obs to created stacked bars on the y axis. If None, the bars are not split.
stacked (bool, default True) – Whether to stack the bars or not.
save (Optional[str], default None) – Path to save the plot. If None, the plot is not saved.
figsize (Optional[Tuple[int | float, int | float]], default None) – Size of figure, e.g. (4, 8). If None, size is determined automatically depending on whether groupby is None or not.
add_labels (bool, default False) – Whether to add labels to the bars giving the number/percentage of cells.
**kwargs (Any) – Additional arguments passed to pandas.DataFrame.plot.bar.
- Returns:
axarr – Array of axes objects containing the plot(s).
- Return type:
Iterable[matplotlib.axes.Axes]
Examples
pl.n_cells_barplot(adata, x="louvain")
pl.n_cells_barplot(adata, x="louvain", groupby="condition")
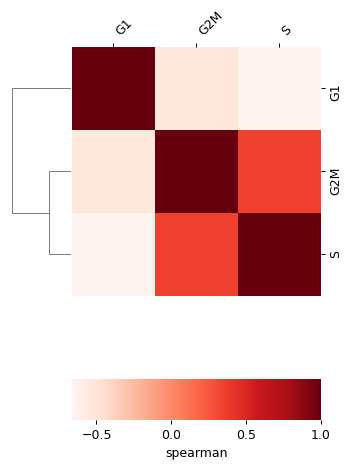
- sctoolbox.plotting.qc_filter.group_correlation(adata: AnnData, groupby: str, method: Literal['spearman', 'pearson', 'kendall'] | Callable = 'spearman', save: str | None = None, **kwargs: Any) ClusterGrid[source]
Plot correlation matrix between groups in groupby.
The function expects the count data in .X to be normalized across cells.
- Parameters:
adata (sc.AnnData) – Annotated data matrix object.
groupby (str) – Name of the column in adata.obs to group cells by.
method (Literal["spearman", "pearson", "kendall"] | Callable, default "spearman") – Correlation method to use. See pandas.DataFrame.corr for options.
save (Optional[str], default None) – Path to save the plot. If None, the plot is not saved.
**kwargs (Any) – Additional arguments passed to seaborn.clustermap.
- Return type:
sns.matrix.ClusterGrid
Examples
import scanpy as sc
import sctoolbox.plotting as pl
adata = sc.datasets.pbmc68k_reduced()
pl.group_correlation(adata, "phase", method="spearman", save=None)
- sctoolbox.plotting.qc_filter.plot_insertsize(adata: AnnData, barcodes: list[str] | None = None, **kwargs: Any) Axes[source]
Plot insertsize distribution for barcodes in adata. Requires adata.uns[“insertsize_distribution”] to be set.
- Parameters:
adata (sc.AnnData) – AnnData object containing insertsize distribution in adata.uns[“insertsize_distribution”].
barcodes (Optional[list[str]], default None) – Subset of barcodes to plot information for. If None, all barcodes are used.
**kwargs (Any) – Additional arguments passed to seaborn.lineplot.
- Returns:
ax – Axes object containing the plot.
- Return type:
matplotlib.axes.Axes
- Raises:
ValueError – If adata.uns[“insertsize_distribution”] is not set.
- sctoolbox.plotting.qc_filter.quality_violin(adata: AnnData, columns: list[str], which: Literal['obs', 'var'] = 'obs', groupby: str | None = None, ncols: int = 2, header: list[str] | None = None, color_list: list[str | tuple[float | int, float | int, float | int]] | None = None, title: str | None = None, thresholds: dict[str, dict[str, dict[Literal['min', 'max'], int | float]] | dict[Literal['min', 'max'], int | float]] | None = None, global_threshold: bool = True, interactive: bool = True, save: str | None = None, **kwargs: Any) tuple[Any, dict[str, Any]][source]
Plot quality measurements for cells/features in an anndata object.
Notes
Notebook needs “%matplotlib widget” before the call for the interactive sliders to work.
- Parameters:
adata (sc.AnnData) – Anndata object containing quality measures in .obs/.var
columns (list[str]) – A list of columns in .obs/.var to show measures for.
which (Literal["obs", "var"], default "obs") – Which table to show quality for. Either “obs” / “var”.
groupby (Optional[str], default "condition") – A column in table to values on the x-axis.
ncols (int, default 2) – Number of columns in the plot.
header (Optional[list[str]], defaul None) – A list of custom headers for each measure given in columns.
color_list (Optional[list[str]], default None) – A list of colors to use for violins. If None, colors are chosen automatically.
title (Optional[str], default None) – The title of the full plot.
thresholds (Optional[dict[str, dict[str, dict[Literal["min", "max"], int | float]] | dict[Literal["min", "max"], int | float]]], default None) – Dictionary containing initial min/max thresholds to show in plot.
global_threshold (bool, default True) – Whether to use global thresholding as the initial setting. If False, thresholds are set per group.
interactive (bool, default True) – Whether to show interactive sliders. If False, the static matplotlib plot is shown.
save (Optional[str], optional) – Save the figure to the path given in ‘save’. Default: None (figure is not saved).
**kwargs (Any) – Additional arguments passed to seaborn.violinplot.
- Returns:
Tuple[Union[matplotlib.figure.Figure, ipywidgets.HBox], Dict[str, Union[List[ipywidgets.FloatRangeSlider.observe], Dict[str, ipywidgets.FloatRangeSlider.observe]]]] First element contains figure (static) or figure and sliders (interactive). The second element is a nested dict of slider values that are continously updated.
- Return type:
Tuple[Any, Dict[str, Any]]
- Raises:
ValueError – If ‘which’ is not ‘obs’ or ‘var’ or if columns are not in table.
- sctoolbox.plotting.qc_filter.get_slider_thresholds(slider_dict: dict) dict[source]
Get thresholds from sliders.
- Parameters:
slider_dict (dict) – Dictionary of sliders in the format ‘slider_dict[column][group] = slider’ or ‘slider_dict[column] = slider’ if no grouping.
- Returns:
dict in the format threshold_dict[column][group] = {“min”: <min_threshold>, “max”: <max_threshold>} or threshold_dict[column] = {“min”: <min_threshold>, “max”: <max_threshold>} if no grouping
- Return type:
dict
highly_variable
Plots for highly variable genes, e.g. as a result of sc.tl.highly_variable.
- sctoolbox.plotting.highly_variable.violin_HVF_distribution(adata: AnnData, **kwargs: Any)[source]
Plot the distribution of the HVF as violinplot.
- Parameters:
adata (sc.AnnData) – AnnData object containing columns [‘highly_variable’, ‘n_cells_by_counts’] column.
**kwargs (Any) – Keyword arguments to be passed to matplotlib.pyplot.violinplot.
- sctoolbox.plotting.highly_variable.scatter_HVF_distribution(adata: AnnData, **kwargs: Any)[source]
Plot the distribution of the HVF as scatterplot.
- Parameters:
adata (sc.AnnData) – AnnData object containing columns [‘variability_score’, ‘n_cells’] column.
**kwargs (Any) – Keyword arguments to be passed to matplotlib.pyplot.scatter.
embedding
Funtions of different single cell embeddings e.g. UMAP, PCA, tSNE.
- sctoolbox.plotting.embedding.sc_colormap() ListedColormap[source]
Get a colormap with 0-count cells colored grey (to use for embeddings).
- Returns:
cmap – Colormap with 0-count cells colored grey.
- Return type:
matplotlib.colors.ListedColormap
- sctoolbox.plotting.embedding.grey_colormap() ListedColormap[source]
Get a colormap with grey-scale colors, but without white to still show cells.
- Returns:
cmap – Grey-scale colormap.
- Return type:
matplotlib.colors.ListedColormap
- sctoolbox.plotting.embedding.flip_embedding(adata: AnnData, key: str = 'X_umap', how: Literal['vertical', 'horizontal'] = 'vertical')[source]
Flip the embedding in adata.obsm[key] along the given axis.
- Parameters:
adata (sc.AnnData) – Annotated data matrix object.
key (str, default "X_umap") – Key in adata.obsm to flip.
how (Literal["vertical", "horizontal"], default "vertical") – Axis to flip along. Can be “vertical” (flips up/down) or “horizontal” (flips left/right).
- Raises:
KeyError – If the given key is not found in adata.obsm.
ValueError – If the given ‘how’ is not supported.
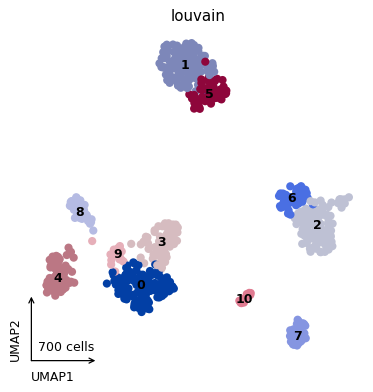
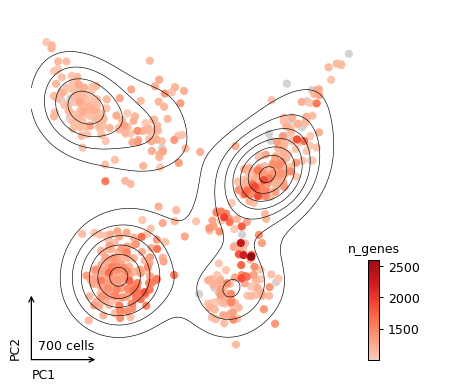
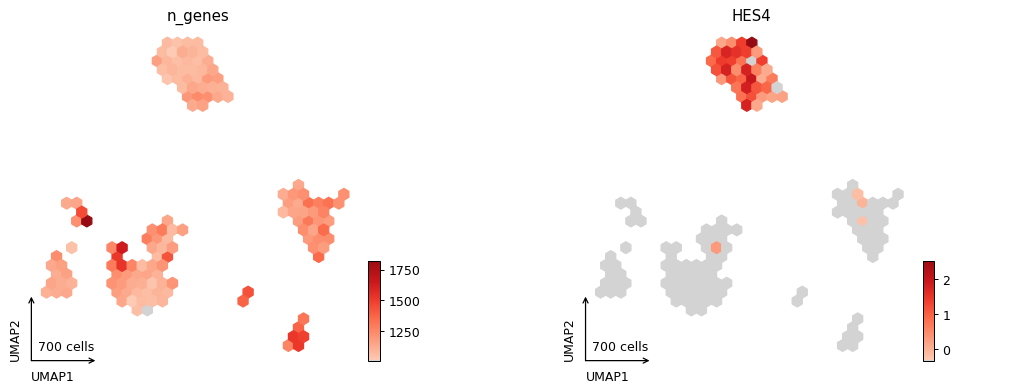
- sctoolbox.plotting.embedding.plot_embedding(adata: AnnData, method: str = 'umap', color: list[str | None] | str | None = None, style: Literal['dots', 'hexbin', 'density'] = 'dots', show_borders: bool = False, show_contour: bool = False, show_count: bool = True, show_title: bool = True, hexbin_gridsize: int = 30, shrink_colorbar: float | int = 0.3, square: bool = True, save: str | None = None, **kwargs) _SupportsArray[dtype[Any]] | _NestedSequence[_SupportsArray[dtype[Any]]] | bool | int | float | complex | str | bytes | _NestedSequence[bool | int | float | complex | str | bytes][source]
Plot a dimensionality reduction embedding e.g. UMAP or tSNE with different style options. This is a wrapper around scanpy.pl.embedding.
- Parameters:
adata (anndata.AnnData) – Annotated data matrix object.
method (str, default "umap") – Dimensionality reduction method to use. Must be a key in adata.obsm, or a method available as “X_<method>” such as “umap”, “tsne” or “pca”.
color (Optional[str | list[str]], default None) – Key for annotation of observations/cells or variables/genes.
style (Literal["dots", "hexbin", "density".], default "dots") – Style of the plot. Must be one of “dots”, “hexbin” or “density”.
show_borders (bool, default False) – Whether to show borders around embedding plot. If False, the borders are removed and a small legend is added to the plot.
show_contour (bool, default False) – Whether to show a contour plot on top of the plot.
show_count (bool, default True) – Whether to show the number of cells in the plot.
show_title (bool, default True) – Whether to show the titles of the plots. If False, the titles are removed and the names are added to the colorbar/legend instead.
hexbin_gridsize (int, default 30) – Number of hexbins across plot - higher values give smaller bins. Only used if style=”hexbin”.
shrink_colorbar (float | int, default 0.3) – Shrink the height of the colorbar by this factor.
square (bool, default True) – Whether to make the plot square.
save (Optional[str], default None) – Filename to save the figure.
**kwargs (arguments) – Additional keyword arguments are passed to
scanpy.pl.plot_embedding().
- Returns:
axes – Array of axis objects
- Return type:
npt.ArrayLike
- Raises:
KeyError – If the given method is not found in adata.obsm.
ValueError – If the ‘components’ given is larger than the number of components in the embedding.
Examples
pl.plot_embedding(adata, color="louvain", legend_loc="on data")
_ = pl.plot_embedding(adata, method="pca", color="n_genes", show_contour=True, show_title=False)
_ = pl.plot_embedding(adata, color=['n_genes', 'HES4'], style="hexbin")
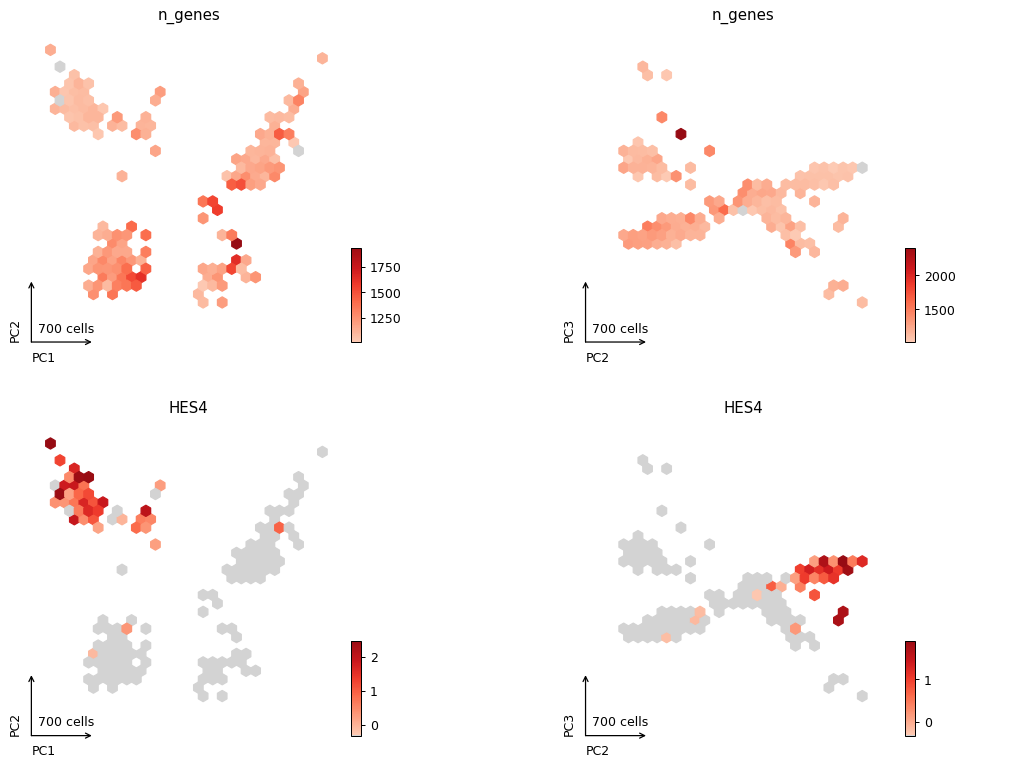
_ = pl.plot_embedding(adata, method="pca", color=['n_genes', 'HES4'],
                      style="hexbin", components=["1,2", "2,3"], ncols=2)
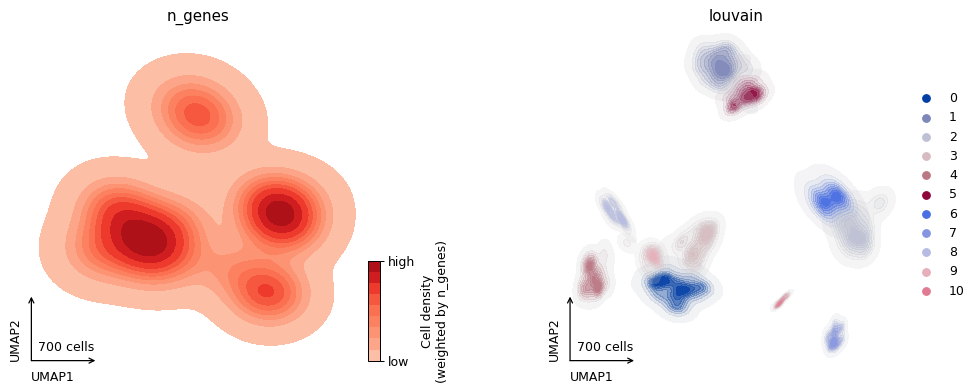
ax = pl.plot_embedding(adata, color=['n_genes', 'louvain'], style="density")
- sctoolbox.plotting.embedding.search_umap_parameters(adata: AnnData, min_dist_range: tuple[float | int, float | int, float | int] = (0.2, 0.9, 0.2), spread_range: tuple[float | int, float | int, float | int] = (0.5, 2.0, 0.5), color: str | None = None, n_components: int = 2, threads: int = 4, save: str | None = None, **kwargs: Any) ndarray[source]
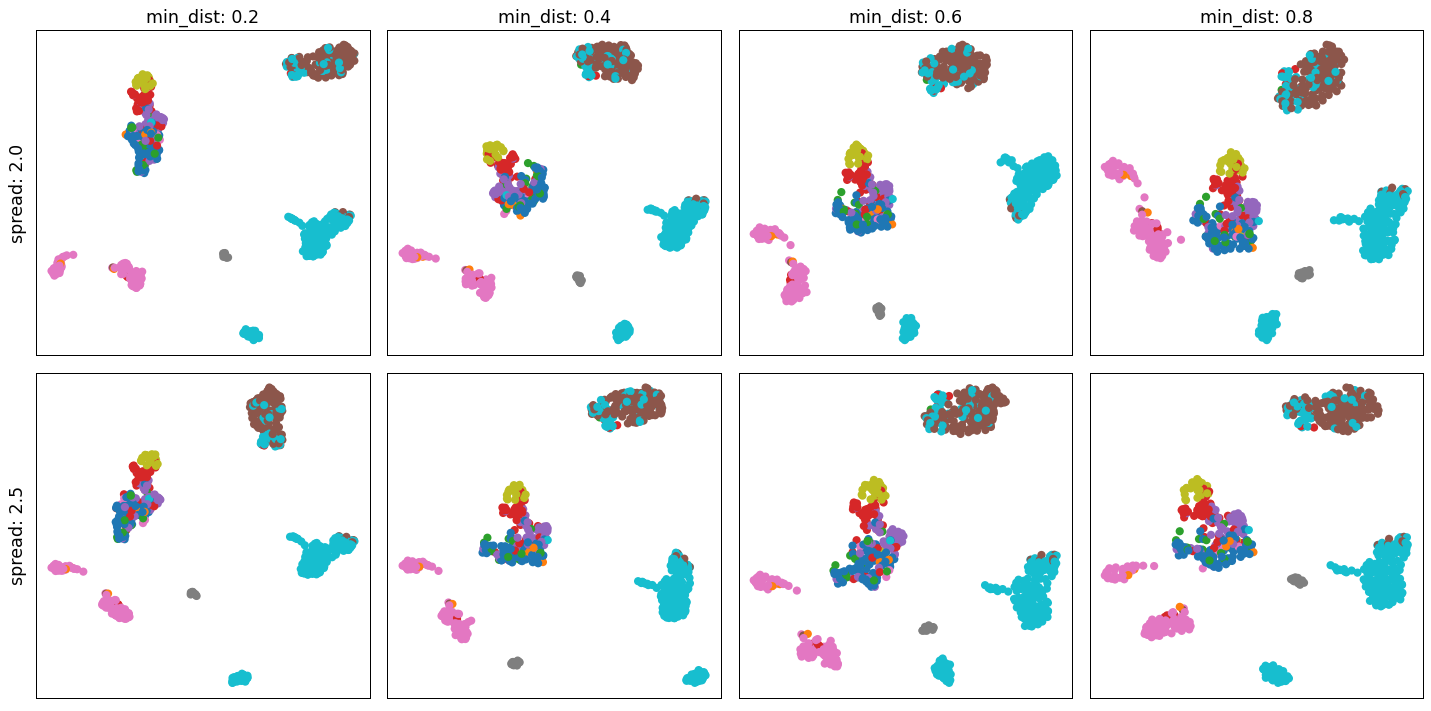
Plot a grid of different combinations of min_dist and spread variables for UMAP plots.
- Parameters:
adata (sc.AnnData) – Annotated data matrix object.
min_dist_range (Tuple[float | int, float | int, float | int], default: (0.2, 0.9, 0.2)) – Range of ‘min_dist’ parameter values to test. Must be a tuple in the form (min, max, step).
spread_range (Tuple[float | int, float | int, float | int], default (0.5, 2.0, 0.5)) – Range of ‘spread’ parameter values to test. Must be a tuple in the form (min, max, step).
color (Optional[str], default None) – Name of the column in adata.obs to color plots by. If None, plots are not colored.
n_components (int, default 2) – Number of components in UMAP calculation.
threads (int, default 4) – Number of threads to use for UMAP calculation.
save (Optional[str], default None) – Path to save the figure to. If None, the figure is not saved.
**kwargs (Any) – Additional keyword arguments are passed to
scanpy.tl.umap().
- Returns:
2D numpy array of axis objects
- Return type:
np.ndarray
Examples
pl.search_umap_parameters(adata, min_dist_range=(0.2, 0.9, 0.2),
                                 spread_range=(2.0, 3.0, 0.5),
                                 color="bulk_labels")
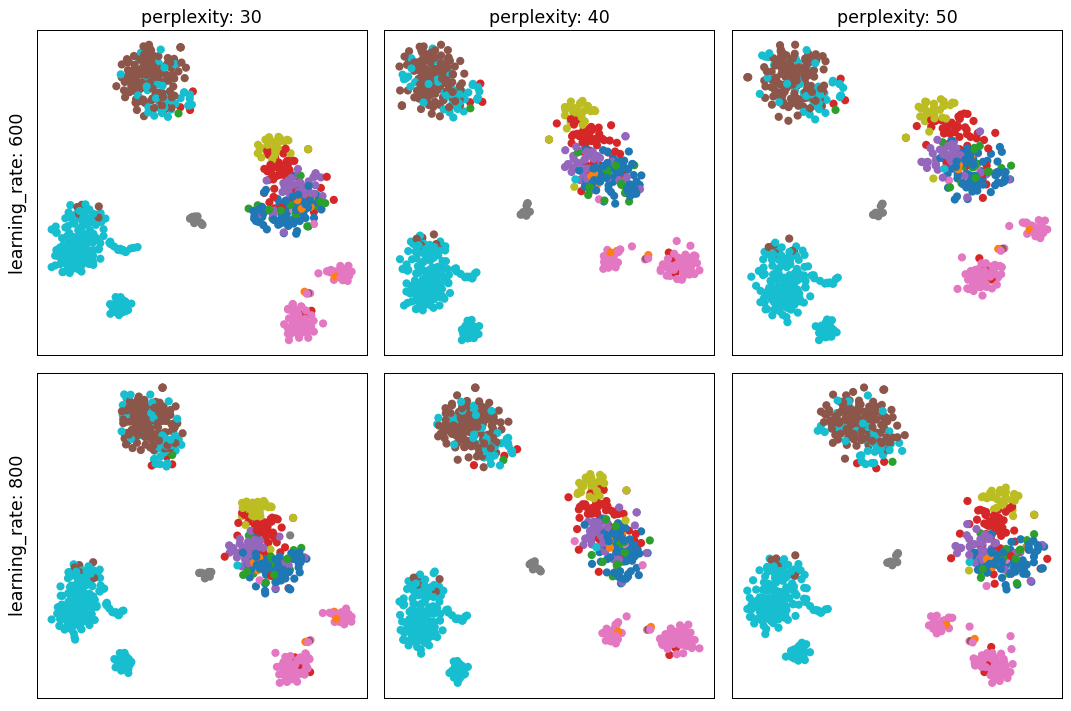
- sctoolbox.plotting.embedding.search_tsne_parameters(adata: AnnData, perplexity_range: tuple[int, int, int] = (30, 60, 10), learning_rate_range: tuple[int, int, int] = (600, 1000, 200), color: str | None = None, threads: int = 4, save: str | None = None, **kwargs: Any) ndarray[source]
Plot a grid of different combinations of perplexity and learning_rate variables for tSNE plots.
- Parameters:
adata (sc.AnnData) – Annotated data matrix object.
perplexity_range (Tuple[int, int, int], default (30, 60, 10)) – tSNE parameter: Range of ‘perplexity’ parameter values to test. Must be a tuple in the form (min, max, step).
learning_rate_range (Tuple[int, int, int], default (600, 1000, 200)) – tSNE parameter: Range of ‘learning_rate’ parameter values to test. Must be a tuple in the form (min, max, step).
color (Optional[str], default None) – Name of the column in adata.obs to color plots by. If None, plots are not colored.
threads (int, default 1) – The threads paramerter is currently not supported. Please leave at 1. This may be fixed in the future.
save (Optional[str], default None (not saved)) – Path to save the figure to.
**kwargs (Any) – Additional keyword arguments are passed to
scanpy.tl.tsne().
- Returns:
2D numpy array of axis objects
- Return type:
np.ndarray
Examples
pl.search_tsne_parameters(adata, perplexity_range=(30, 60, 10),
                                 learning_rate_range=(600, 1000, 200),
                                 color="bulk_labels")
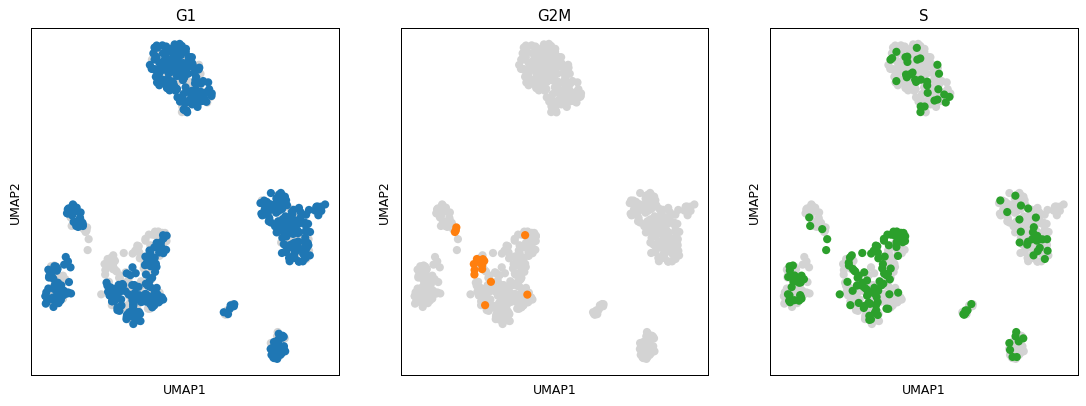
- sctoolbox.plotting.embedding.plot_group_embeddings(adata: AnnData, groupby: str, embedding: Literal['umap', 'tsne', 'pca'] = 'umap', ncols: int = 4, save: str | None = None, **kwargs: Any) ndarray[source]
Plot a grid of embeddings (UMAP/tSNE/PCA) per group of cells within ‘groupby’.
- Parameters:
adata (sc.AnnData) – Annotated data matrix object.
groupby (str) – Name of the column in adata.obs to group by.
embedding (Literal["umap", "tsne", "pca"], default "umap") – Embedding to plot. Must be one of “umap”, “tsne”, “pca”.
ncols (int, default 4) – Number of columns in the figure.
save (Optional[str], default None) – Path to save the figure.
**kwargs (Any) – Additional keyword arguments are passed to
scanpy.pl.umap()orscanpy.pl.tsne()orscanpy.pl.pca().
- Returns:
Flat numpy array of axis objects
- Return type:
np.ndarray
Examples
pl.plot_group_embeddings(adata, 'phase', embedding='umap', ncols=4)
- sctoolbox.plotting.embedding.compare_embeddings(adata_list: list[AnnData], var_list: list[str] | str, embedding: Literal['umap', 'tsne', 'pca'] = 'umap', adata_names: list[str] | None = None, **kwargs: Any) ndarray[source]
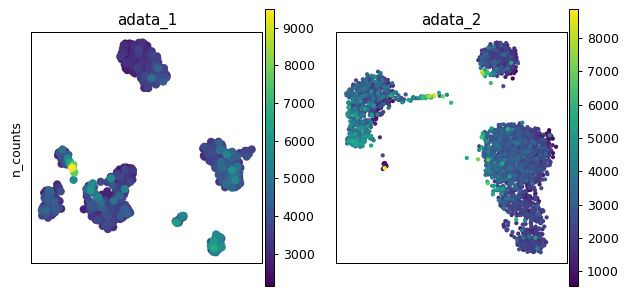
Compare embeddings across different adata objects.
Plots a grid of embeddings with the different adatas on the x-axis, and colored variables on the y-axis.
- Parameters:
adata_list (list[sc.AnnData]) – List of AnnData objects to compare.
var_list (list[str] | str) – List of variables to color in plot.
embedding (Literal["umap", "tsne", "pca"], default "umap") – Embedding to plot. Must be one of “umap”, “tsne” or “pca”.
adata_names (Optional[list[str]], default None (adatas will be named adata_1, adata_2, etc.)) – List of names for the adata objects. Must be the same length as adata_list or None
**kwargs (Any) – Additional arguments to pass to sc.pl.umap/sc.pl.tsne/sc.pl.pca.
- Returns:
2D numpy array of axis objects
- Return type:
np.ndarray
- Raises:
ValueError – If none of the variables in var_list are found in any of the adata objects.
Examples
import scanpy as sc
adata1 = sc.datasets.pbmc68k_reduced()
adata2 = sc.datasets.pbmc3k_processed()
adata_list = [adata1, adata2]
var_list = ['n_counts', 'n_cells']
pl.compare_embeddings(adata_list, var_list)
- sctoolbox.plotting.embedding.plot_3D_UMAP(adata: AnnData, color: str, save: str, **kwargs: Any) None[source]
Save 3D UMAP plot to a html file.
- Parameters:
adata (sc.AnnData) – Annotated data matrix.
color (str) – Variable to color in plot. Must be a column in adata.obs or an index in adata.var.
save (str) – Save prefix. Plot will be saved to <save>.html.
**kwargs (Any) – Additional keyword arguments are passed to
plotly.graph_objects.Scatter3d().
- Raises:
KeyError – If the given ‘color’ attribute was not found in adata.obs columns or adata.var index.
Examples
min_dist = 0.3
spread = 2.5
sc.tl.umap(adata, min_dist=min_dist, spread=spread, n_components=3)
pl.plot_3D_UMAP(adata, color="louvain", save="my3d_umap")
This will create an .html-file with the interactive 3D UMAP:
my3d_umap.html
- sctoolbox.plotting.embedding.umap_marker_overview(adata: AnnData, markers: list[str] | str, ncols: int = 3, figsize: tuple[int, int] | None = None, save: str | None = None, cbar_label: str = 'Relative expr.', **kwargs: Any) list[source]
Plot a pretty grid of UMAPs with marker gene expression.
- Parameters:
adata (sc.AnnData) – Annotated data matrix.
markers (list[str] | str) – List of markers or singel marker
ncols (int, default 3) – Number of columns in grid.
figsize (Optional[Tuple[int, int]], default None) – Tuple of figure size.
save (Optional[str], default None) – If not None save plot under given name.
cbar_label (str, default "Relative expr.") – Colorbar label
**kwargs (Any) – Additional parameter for scanpy.pl.umap()
- Returns:
List of axis objects
- Return type:
list
- sctoolbox.plotting.embedding.anndata_overview(adatas: dict[str, AnnData], color_by: str | list[str], plots: list[Literal['UMAP', 'tSNE', 'PCA', 'PCA-var', 'LISI']] | Literal['UMAP', 'tSNE', 'PCA', 'PCA-var', 'LISI'] = ['PCA', 'PCA-var', 'UMAP', 'LISI'], figsize: tuple[int, int] | None = None, max_clusters: int = 20, output: str | None = None, dpi: int = 300, **kwargs: Any) _SupportsArray[dtype[Any]] | _NestedSequence[_SupportsArray[dtype[Any]]] | bool | int | float | complex | str | bytes | _NestedSequence[bool | int | float | complex | str | bytes][source]
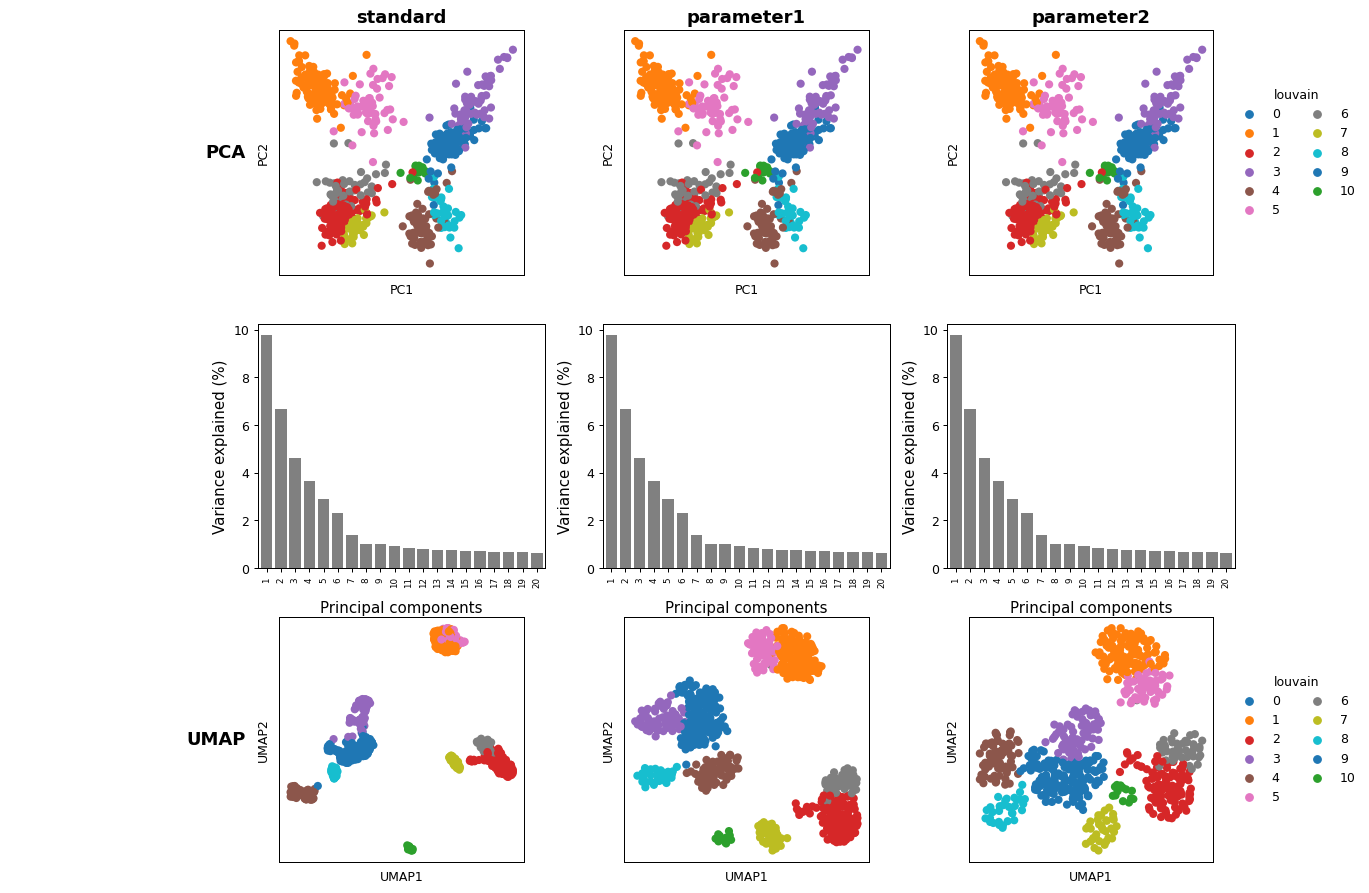
Create a multipanel plot comparing PCA/UMAP/tSNE/(…) plots for different adata objects.
- Parameters:
adatas (dict[str, sc.AnnData]) – Dict containing an anndata object for each batch correction method as values. Keys are the name of the respective method. E.g.: {“bbknn”: anndata}
color_by (str | list[str]) – Name of the .obs column to use for coloring in applicable plots (e.g. for UMAP or PCA).
plots (Union[list[Literal["UMAP", "tSNE", "PCA", "PCA-var", "LISI"]],) – Literal[“UMAP”, “tSNE”, “PCA”, “PCA-var”, “LISI”]], default [“PCA”, “PCA-var”, “UMAP”, “LISI”] Decide which plots should be created. Options are [“UMAP”, “tSNE”, “PCA”, “PCA-var”, “LISI”] Note: List order is forwarded to plot. - UMAP: Plots the UMAP embedding of the data. - tSNE: Plots the tSNE embedding of the data. - PCA: Plots the PCA embedding of the data. - PCA-var: Plots the variance explained by each PCA component. - LISI: Plots the distribution of any “LISI_score*” scores available in adata.obs
figsize (Optional[Tuple[int, int]], default None) – Size of the plot in inch. Defaults to automatic size based on number of columns/rows.
max_clusters (int, default 20) – Maximum number of clusters to show in legend.
output (Optional[str], default None) – Path to plot output file.
dpi (int, default 300) – Dots per inch for output
**kwargs (Any) – Additional keyword arguments are passed to
scanpy.pl.umap(),scanpy.pl.tsne()orscanpy.pl.pca().
- Returns:
axes – Array of matplotlib.axes.Axes objects created by matplotlib.
- Return type:
npt.ArrayLike
- Raises:
ValueError – If any of the adatas is not of type anndata.AnnData.
Examples
adatas = {}  # dictionary of adata objects
adatas["standard"] = adata
adatas["parameter1"] = sc.tl.umap(adata, min_dist=1, copy=True)
adatas["parameter2"] = sc.tl.umap(adata, min_dist=2, copy=True)

pl.anndata_overview(adatas, color_by="louvain", plots=["PCA", "PCA-var", "UMAP"])
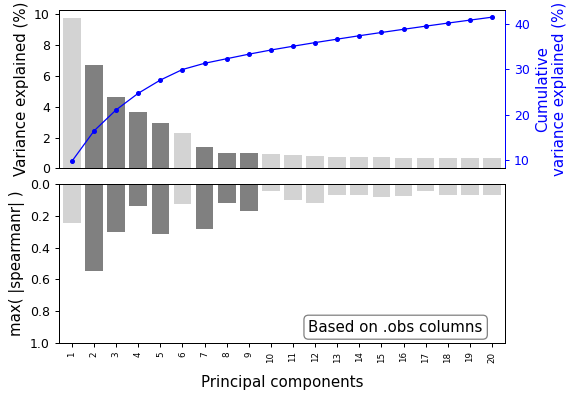
- sctoolbox.plotting.embedding.plot_pca_variance(adata: AnnData, method: str = 'pca', n_pcs: int = 20, selected: list[int] | None = None, show_cumulative: bool = True, n_thresh: int | None = None, corr_plot: Literal['spearmanr', 'pearsonr'] | None = None, corr_on: Literal['obs', 'var'] = 'obs', corr_thresh: float | None = None, ax: Axes | None = None, save: str | None = None, sel_col: str = 'grey', om_col: str = 'lightgrey') Axes[source]
Plot the pca variance explained by each component as a barplot.
- Parameters:
adata (sc.AnnData) – Annotated data matrix object.
method (str, default "pca") – Method used for calculating variation. Is used to look for the coordinates in adata.uns[<method>].
n_pcs (int, default 20) – Number of components to plot.
selected (Optional[List[int]], default None) – Number of components to highlight in the plot.
show_cumulative (bool, default True) – Whether to show the cumulative variance explained in a second y-axis.
n_thresh (Optional[int], default None) – Enables a vertical threshold line.
corr_plot (Optional[str], default None) – Enable correlation plot. Shows highest absolute correlation for each bar.
corr_on (Literal["obs", "var"], default "obs") – Calculate correlation on either observations (adata.obs) or variables (adata.var).
corr_thresh (Optional[float], default None) – Enables a red threshold line in the lower plot.
ax (Optional[matplotlib.axes.Axes], default None) – Axes object to plot on. If None, a new figure is created.
save (Optional[str], default None (not saved)) – Filename to save the figure. If None, the figure is not saved.
sel_col (str, default "grey") – Bar color of selected bars.
om_col (str, default "lightgrey") – Bar color of omitted bars.
- Returns:
Axes object containing the plot.
- Return type:
matplotlib.axes.Axes
- Raises:
KeyError – If the given method is not found in adata.uns.
Examples
pl.plot_pca_variance(adata, method="pca",
              n_pcs=20,
              selected=[2, 3, 4, 5, 7, 8, 9],
              corr_plot="spearmanr")
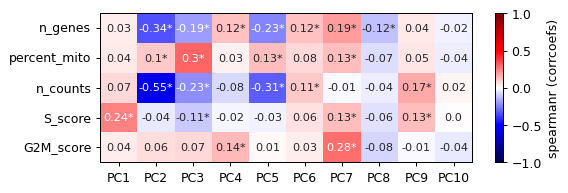
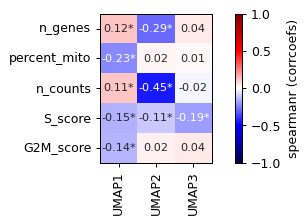
- sctoolbox.plotting.embedding.plot_pca_correlation(adata: AnnData, which: Literal['obs', 'var'] = 'obs', basis: str = 'pca', n_components: int = 10, columns: list[str] | None = None, pvalue_threshold: float = 0.01, method: Literal['spearmanr', 'pearsonr'] = 'spearmanr', plot_values: Literal['corrcoefs', 'pvalues'] = 'corrcoefs', figsize: tuple[int, int] | None = None, title: str | None = None, save: str | None = None, **kwargs: Any) Axes[source]
Plot a heatmap of the correlation between dimensionality reduction coordinates (e.g. umap or pca) and the given columns.
- Parameters:
adata (sc.AnnData) – Annotated data matrix object.
which (Literal["obs", "var"], default "obs") – Whether to use the observations (“obs”) or variables (“var”) for the correlation.
basis (str, default "pca") – Dimensionality reduction to calculate correlation with. Must be a key in adata.obsm, or a basis available as “X_<basis>” such as “umap”, “tsne” or “pca”.
n_components (int, default 10) – Number of components to use for the correlation.
columns (Optional[list[str]], default None) – List of columns to use for the correlation. If None, all numeric columns are used.
pvalue_threshold (float, default 0.01) – Threshold for significance of correlation. If the p-value is below this threshold, a star is added to the heatmap.
method (Literal["spearmanr", "pearson"], default "spearmanr") – Method to use for correlation. Must be either “pearsonr” or “spearmanr”.
plot_values (Literal["corrcoefs", "pvalues"], default "corrcoefs") – Values which will be used to plot the heatmap, either “corrcoefs” (correlation coefficients) or “pvalues”. P-values will be shown as np.sign(corrcoefs)*np.log10(p-value), the logged p-value with the sign of the corresponding correlation coefficient.
figsize (Optional[Tuple[int, int]], default None) – Size of the figure in inches. If None, the size is automatically determined.
title (Optional[str], default None) – Title of the plot. If None, no title is added.
save (Optional[str], default None) – Filename to save the figure.
**kwargs (Any) – Additional keyword arguments are passed to
seaborn.heatmap().
- Returns:
ax – Axes object containing the heatmap.
- Return type:
matplotlib.axes.Axes
Examples
pl.plot_pca_correlation(adata, which="obs")
pl.plot_pca_correlation(adata, basis="umap")
clustering
Functions for plotting clustering results e.g. UMAPs colored by clusters.
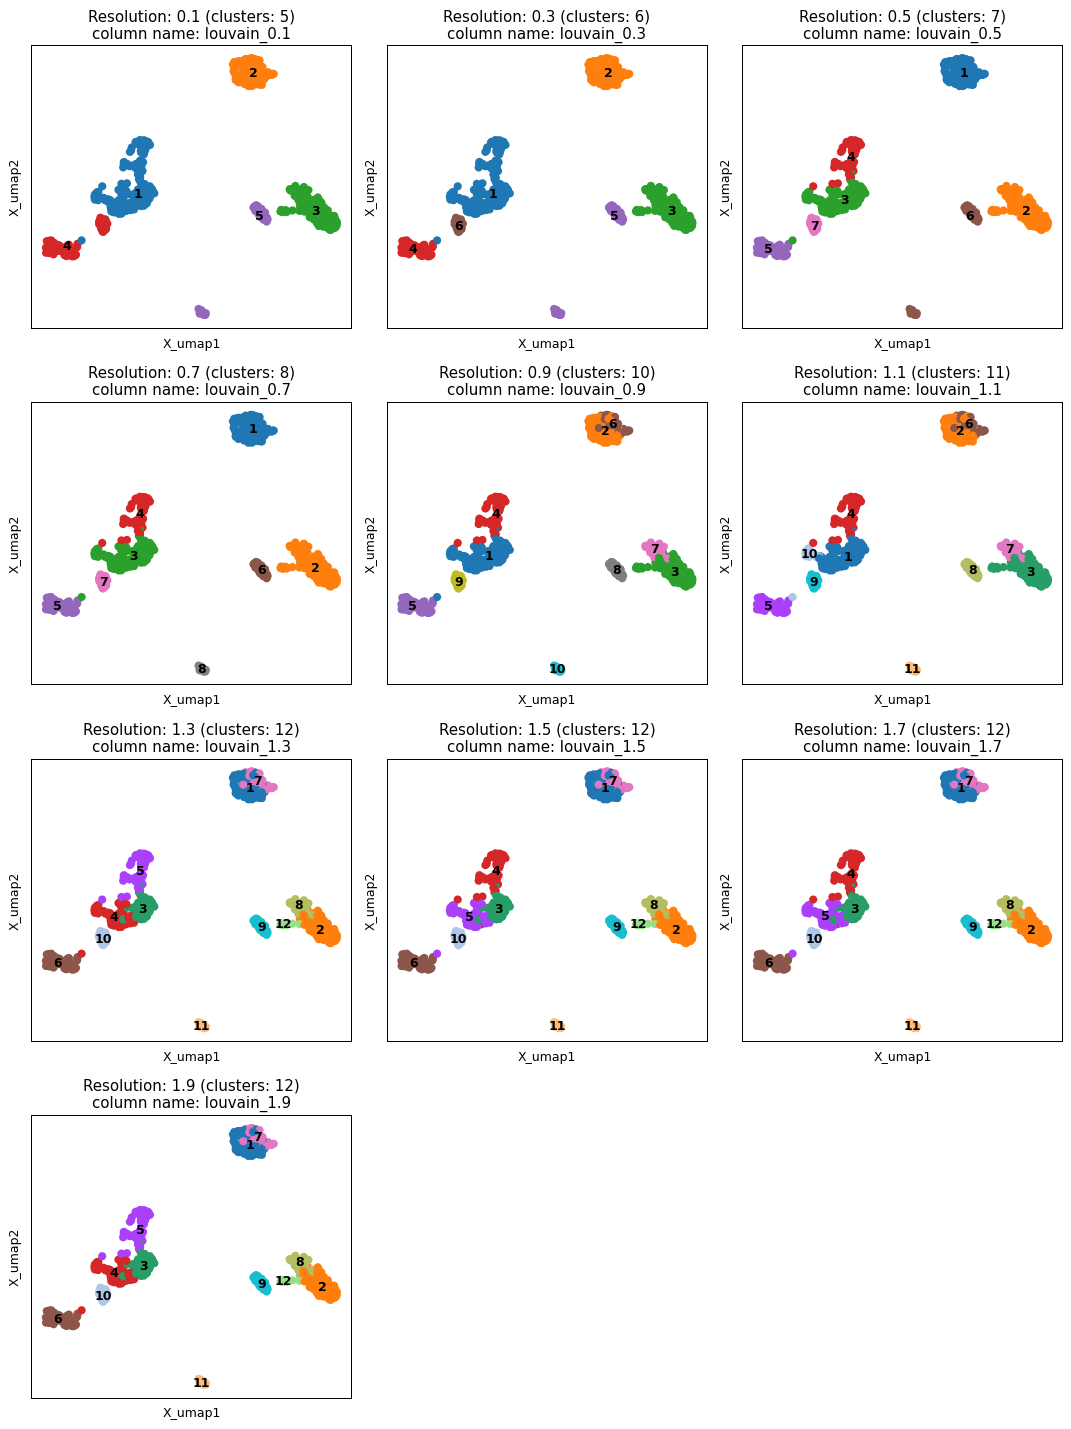
- sctoolbox.plotting.clustering.search_clustering_parameters(adata: AnnData, method: Literal['leiden', 'louvain'] = 'leiden', resolution_range: tuple[float | int, float | int, float | int] = (0.1, 1, 0.1), embedding: str = 'X_umap', ncols: int = 3, verbose: bool = True, save: str | None = None, **kwargs: Any) ndarray[source]
Plot a grid of different resolution parameters for clustering.
- Parameters:
adata (sc.AnnData) – Annotated data matrix object.
method (str, default: "leiden") – Clustering method to use. Can be one of ‘leiden’ or ‘louvain’.
resolution_range (Tuple[float | int, float | int, float | int], default: (0.1, 1, 0.1)) – Range of ‘resolution’ parameter values to test. Must be a tuple in the form (min, max, step).
embedding (str, default: "X_umap".) – Embedding method to use. Must be a key in adata.obsm. If not, will try to use f”X_{embedding}”.
ncols (int, default: 3) – Number of columns in the grid.
verbose (bool, default: True) – Print progress to console.
save (Optional[str], default None) – Path to save figure.
**kwargs (Any) – Keyword arguments to be passed to sc.pl.embedding.
- Returns:
axarr – Array of axes objects containing the plot(s).
- Return type:
np.ndarray
- Raises:
ValueError – If step is lager than max - min
KeyError – If embedding is not found in adata.obsm.
Examples
pl.search_clustering_parameters(adata, method='louvain', resolution_range=(0.1, 2, 0.2), embedding='X_umap', ncols=3, verbose=True, save=None)
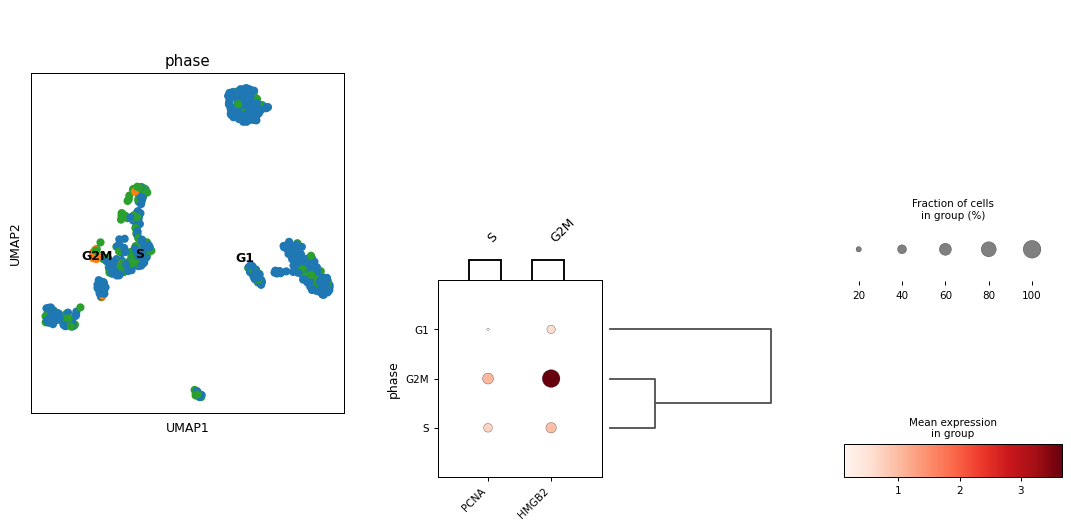
- sctoolbox.plotting.clustering.marker_gene_clustering(adata: AnnData, groupby: str, marker_genes_dict: dict[str, list[str]], show_umap: bool = True, save: str | None = None, figsize: tuple[int | float, int | float] | None = None, **kwargs: Any) list[source]
Plot an overview of marker genes and clustering.
- Parameters:
adata (sc.AnnData) – Annotated data matrix.
groupby (str) – Key in adata.obs for which to plot the clustering.
marker_genes_dict (dict[str, list[str]]) – Dictionary of marker genes to plot. Keys are the names of the groups and values are lists of marker genes.
show_umap (bool, default: True) – Whether to show a UMAP plot on the left.
save (Optional[str], default: None) – If given, save the figure to this path.
figsize (Tuple[float | int, float | int], default: None) – Size of the figure. If None, use default size.
**kwargs (Any) – Keyword arguments to be passed to sc.pl.dotplot.
- Returns:
axarr – List of axes objects containing the plot(s).
- Return type:
list
Examples
marker_genes_dict = {"S": ["PCNA"], "G2M": ["HMGB2"]}

pl.marker_gene_clustering(adata, "phase", marker_genes_dict, show_umap=True, save=None, figsize=None)
marker_genes
Plots for marker genes e.g. as results of sc.tl.rank_genes_groups.
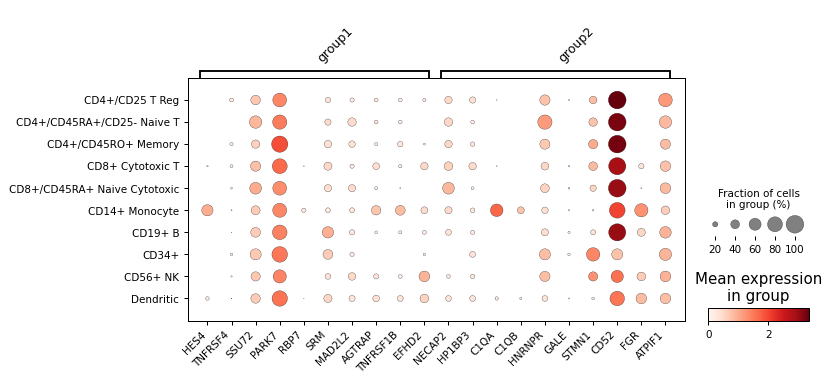
- sctoolbox.plotting.marker_genes.rank_genes_plot(adata: AnnData, key: str | None = 'rank_genes_groups', genes: list[str] | dict[str, list[str]] | None = None, n_genes: int = 15, dendrogram: bool = False, groupby: str | None = None, title: str | None = None, style: Literal['dots', 'heatmap'] = 'dots', measure: str = 'expression', save: str | None = None, **kwargs: Any) dict[source]
Plot expression of genes from rank_genes_groups or from a gene list/dict.
- Parameters:
adata (sc.AnnData) – Annotated data matrix.
key (Optional[str], default "rank_genes_groups") – Key from adata.uns to plot. For example, rank_genes_groups or rank_genes_groups_filtered.
genes (Optional[list[str] | dict[str, list[str]]], default None) – List of genes to plot across groups in ‘groupby’. If a dict is passed, the keys are the group names and the values are lists of genes. Setting ‘genes’ overrides the ‘key’ parameter.
n_genes (int, default 15) – Number of genes to plot if key is specified.
dendrogram (bool, default False) – Whether to show the dendrogram for groups.
groupby (Optional[str], default None) – Key from adata.obs to group cells by.
title (Optional[str], default None) – Title for the plot.
style (Literal["dots", "heatmap"], default "dots") – Style of the plot. Either dots or heatmap.
measure (str, default "expression") – Measure to write in colorbar label. For example, expression or accessibility.
save (Optional[str], default None) – If given, save the figure to this path.
**kwargs (Any) – Additional arguments passed to sc.pl.rank_genes_groups_dotplot or sc.pl.rank_genes_groups_matrixplot.
- Raises:
ValueError –
If style is not one of dots or heatmap 2. If groupby is not specified when genes is specified.
- Returns:
g – Dictionary containing the matplotlib axes objects for the plot.
- Return type:
dict
Examples
pl.rank_genes_plot(adata, n_genes=5)

pl.rank_genes_plot(adata, genes={"group1": adata.var.index[:10], "group2": adata.var.index[10:20]}, groupby="bulk_labels")
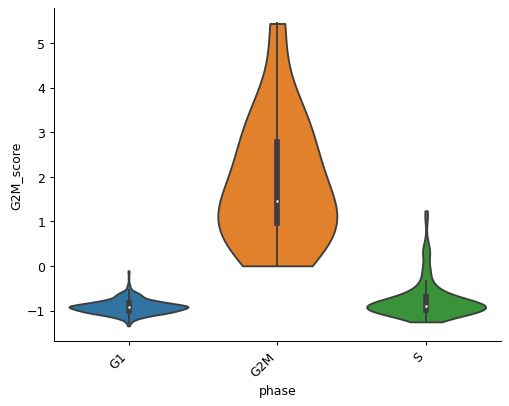
- sctoolbox.plotting.marker_genes.grouped_violin(adata: AnnData, x: str | list[str], y: str | None = None, groupby: str | None = None, figsize: tuple[int | float, int | float] | None = None, title: str | None = None, style: Literal['violin', 'boxplot', 'bar'] = 'violin', normalize: bool = False, ax: Axes | None = None, save: str | None = None, **kwargs: Any) Axes[source]
Create violinplot of values across cells in an adata object grouped by x and ‘groupby’.
Can for example show the expression of one gene across groups (x = obs_group, y = gene), expression of multiple genes grouped by cell type (x = gene_list, groupby = obs_cell_type), or values from adata.obs across cells (x = obs_group, y = obs_column).
- Parameters:
adata (sc.AnnData) – Annotated data matrix.
x (str | list[str]) – Column name in adata.obs or gene name(s) in adata.var.index to group by on the x-axis. Multiple gene names can be given in a list.
y (Optional[str], default None) – A column name in adata.obs or a gene in adata.var.index to plot values for. Only needed if x is a column in adata.obs.
groupby (Optional[str], default None) – Column name in adata.obs to create grouped violins. If None, a single violin is plotted per group in ‘x’.
figsize (Optional[Tuple[int | float, int | float]], default None) – Figure size.
title (Optional[str], default None) – Title of the plot. If None, no title is shown.
style (Literal["violin", "boxplot", "bar"], default "violin") – Plot style. Either “violin” or “boxplot” or “bar”.
normalize (bool, default False) – If True, normalize the values in ‘y’ to the range [0, 1] per group in ‘x’.
ax (Optional[matplotlib.axes.Axes], default None) – A matplotlib axes object to plot violinplots in. If None, a new figure and axes is created.
save (Optional[str], default None) – Path to save the figure to. If None, the figure is not saved.
**kwargs (Any) – Additional arguments passed to seaborn.violinplot or seaborn.boxplot.
- Return type:
matplotlib.axes.Axes
- Raises:
ValueError – If x or y are not columns in adata.obs or a genes in adata.var.index.
Examples
pl.grouped_violin(adata, 'phase', y='G2M_score')
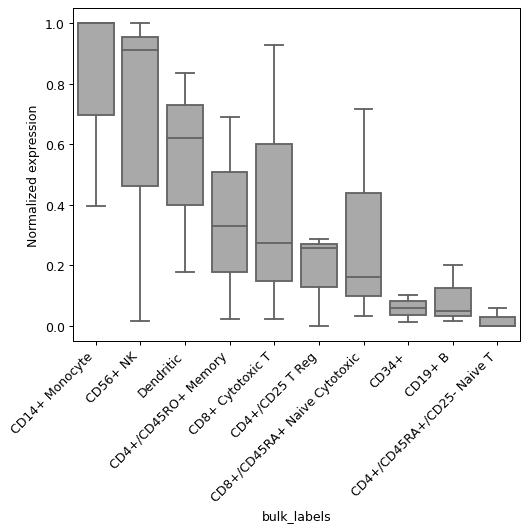
- sctoolbox.plotting.marker_genes.group_expression_boxplot(adata: AnnData, gene_list: list[str], groupby: str, figsize: tuple[int | float, int | float] | None = None, **kwargs: Any) Axes[source]
Plot a boxplot showing summarized gene expression of genes in gene_list across the groups in groupby.
The total gene expression is quantile normalized per group, and are subsequently normalized to 0-1 per gene across groups.
- Parameters:
adata (sc.AnnData) – An annotated data matrix object containing counts in .X.
gene_list (list[str]) – A list of genes to show expression for.
groupby (str) – A column in .obs for grouping cells into groups on the x-axis
figsize (Optional[Tuple[int | float, int | float]], default None (matplotlib default)) – Control the size of the output figure, e.g. (6,10).
**kwargs (Any) – Additional arguments passed to seaborn.boxplot.
- Return type:
matplotlib.axes.Axes
Examples
gene_list=("HES4", "PRMT2", "ITGB2")
pl.group_expression_boxplot(adata, gene_list, groupby="bulk_labels")
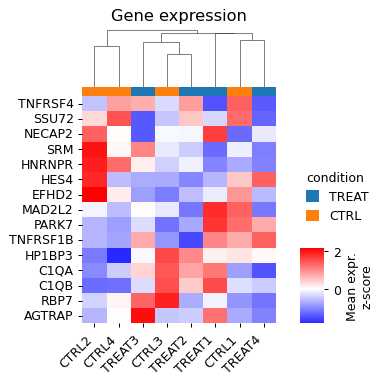
- sctoolbox.plotting.marker_genes.gene_expression_heatmap(adata: AnnData, genes: list[str], cluster_column: str, gene_name_column: str | None = None, title: str | None = None, groupby: str | None = None, row_cluster: bool = True, col_cluster: bool = False, show_row_dendrogram: bool = False, show_col_dendrogram: bool = False, figsize: tuple[int | float, int | float] | None = None, save: str | None = None, **kwargs: Any) Any[source]
Plot a heatmap of z-score normalized gene expression across clusters/groups.
- Parameters:
adata (sc.AnnData) – Annotated data matrix.
genes (list[str]) – List of genes to plot. Must match names in adata.var.index.
cluster_column (str) – Key in adata.obs for which to cluster the x-axis.
gene_name_column (Optional[str], default None) – Column in adata.var for which to use for gene row names. Default is to use the .var index.
title (Optional[str], default None) – Title of the plot.
groupby (Optional[str], default None) – Key in adata.obs for which to plot a colorbar per cluster.
row_cluster (bool, default True) – Whether to cluster the rows.
col_cluster (bool, default False) – Whether to cluster the columns.
show_row_dendrogram (bool, default False) – Whether to show the dendrogram for the rows.
show_col_dendrogram (bool, default False) – Whether to show the dendrogram for the columns.
figsize (Optional[Tuple[int | float, int | float]], default None) – Size of the figure. If None, use default size.
save (Optional[str], default None) – If given, save the figure to this path.
**kwargs (Any) – Additional arguments passed to seaborn.clustermap.
- Returns:
g – sns.matrix.ClusterGrid: The seaborn ClusterGrid object containing the heatmap. Note: Any since sns.matrix.ClusterGrid cannot be checked by beartype.
- Return type:
Any
- Raises:
KeyError – If gene_name_column is not a column in adata.var.
Examples
adata.obs["samples"] = np.random.choice(["CTRL1", "CTRL2", "CTRL3", "CTRL4", "TREAT1", "TREAT2", "TREAT3", "TREAT4"], size=adata.shape[0])
adata.obs["condition"] = adata.obs["samples"].str.extract("([A-Z]+)")

genes = adata.var.index[:15]
pl.gene_expression_heatmap(adata, genes, cluster_column="samples",
                           groupby="condition",
                           title="Gene expression",
                           col_cluster=True,
                           show_col_dendrogram=True,
                           colors_ratio=0.03)
- sctoolbox.plotting.marker_genes.plot_differential_genes(rank_table: DataFrame, title: str = 'Differentially expressed genes', save: str | None = None, **kwargs: Any) Axes[source]
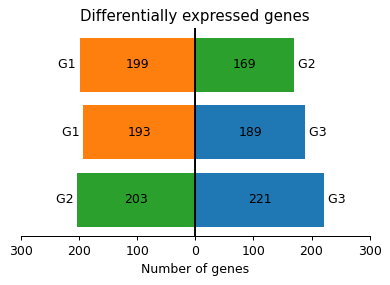
Plot number of differentially expressed genes per contrast in a barplot.
- Parameters:
rank_table (pd.DataFrame) – Output of sctoolbox.tools.marker_genes.pairwise_rank_genes.
title (str, default "Differentially expressed genes") – Title of the plot.
save (Optional[str], default None) – If given, save the figure to this path.
**kwargs (Any) – Keyword arguments passed to pl.bidirectional_barplot.
- Raises:
ValueError – If no significant differentially expressed genes are found in the data.
- Returns:
Axes object.
- Return type:
matplotlib.axes.Axes
Examples
import sctoolbox.tools as tl
adata.obs["groups"] = np.random.choice(["G1", "G2", "G3"], size=adata.shape[0])
pairwise_table = tl.marker_genes.pairwise_rank_genes(adata, foldchange_threshold=0.2, groupby="groups")

pl.plot_differential_genes(pairwise_table)
- sctoolbox.plotting.marker_genes.plot_gene_correlation(adata: AnnData, ref_gene: str, gene_list: list[str] | str, ncols: int = 3, figsize: tuple[int | float, int | float] | None = None, save: str | None = None, **kwargs: Any) Iterable[Axes][source]
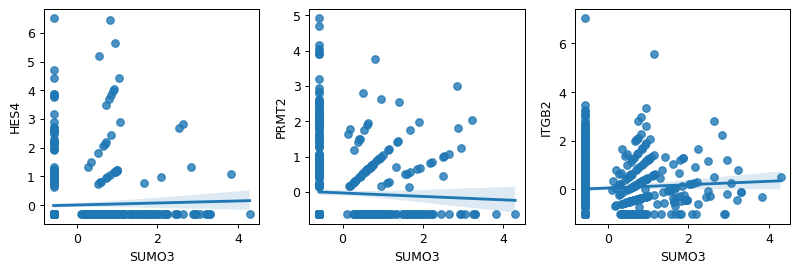
Plot the gene expression of one reference gene against the expression of a set of genes.
- Parameters:
adata (sc.AnnData) – An annotated data matrix object containing counts in .X.
ref_gene (str) – Reference gene to which other genes are comapred to.
gene_list (list[str] | str) – A list of genes to show expression for.
ncols (int, default 3) – Number of columns in plot grid.
figsize (Optional[Tuple[int | float, int | float]], default None) – Control the size of the output figure, e.g. (6,10).
save (Optional[str], default None) – Save the figure to a file.
**kwargs (Any) – Additional arguments passed to seaborn.regplot.
- Returns:
List containing all axis objects.
- Return type:
Iterable[matplotlib.axes.Axes]
Examples
gene_list=("HES4", "PRMT2", "ITGB2")
pl.plot_gene_correlation(adata, "SUMO3", gene_list)
genometracks
Class to create a genome track plot via pyGenomeTracks.
- class sctoolbox.plotting.genometracks.GenomeTracks[source]
Bases:
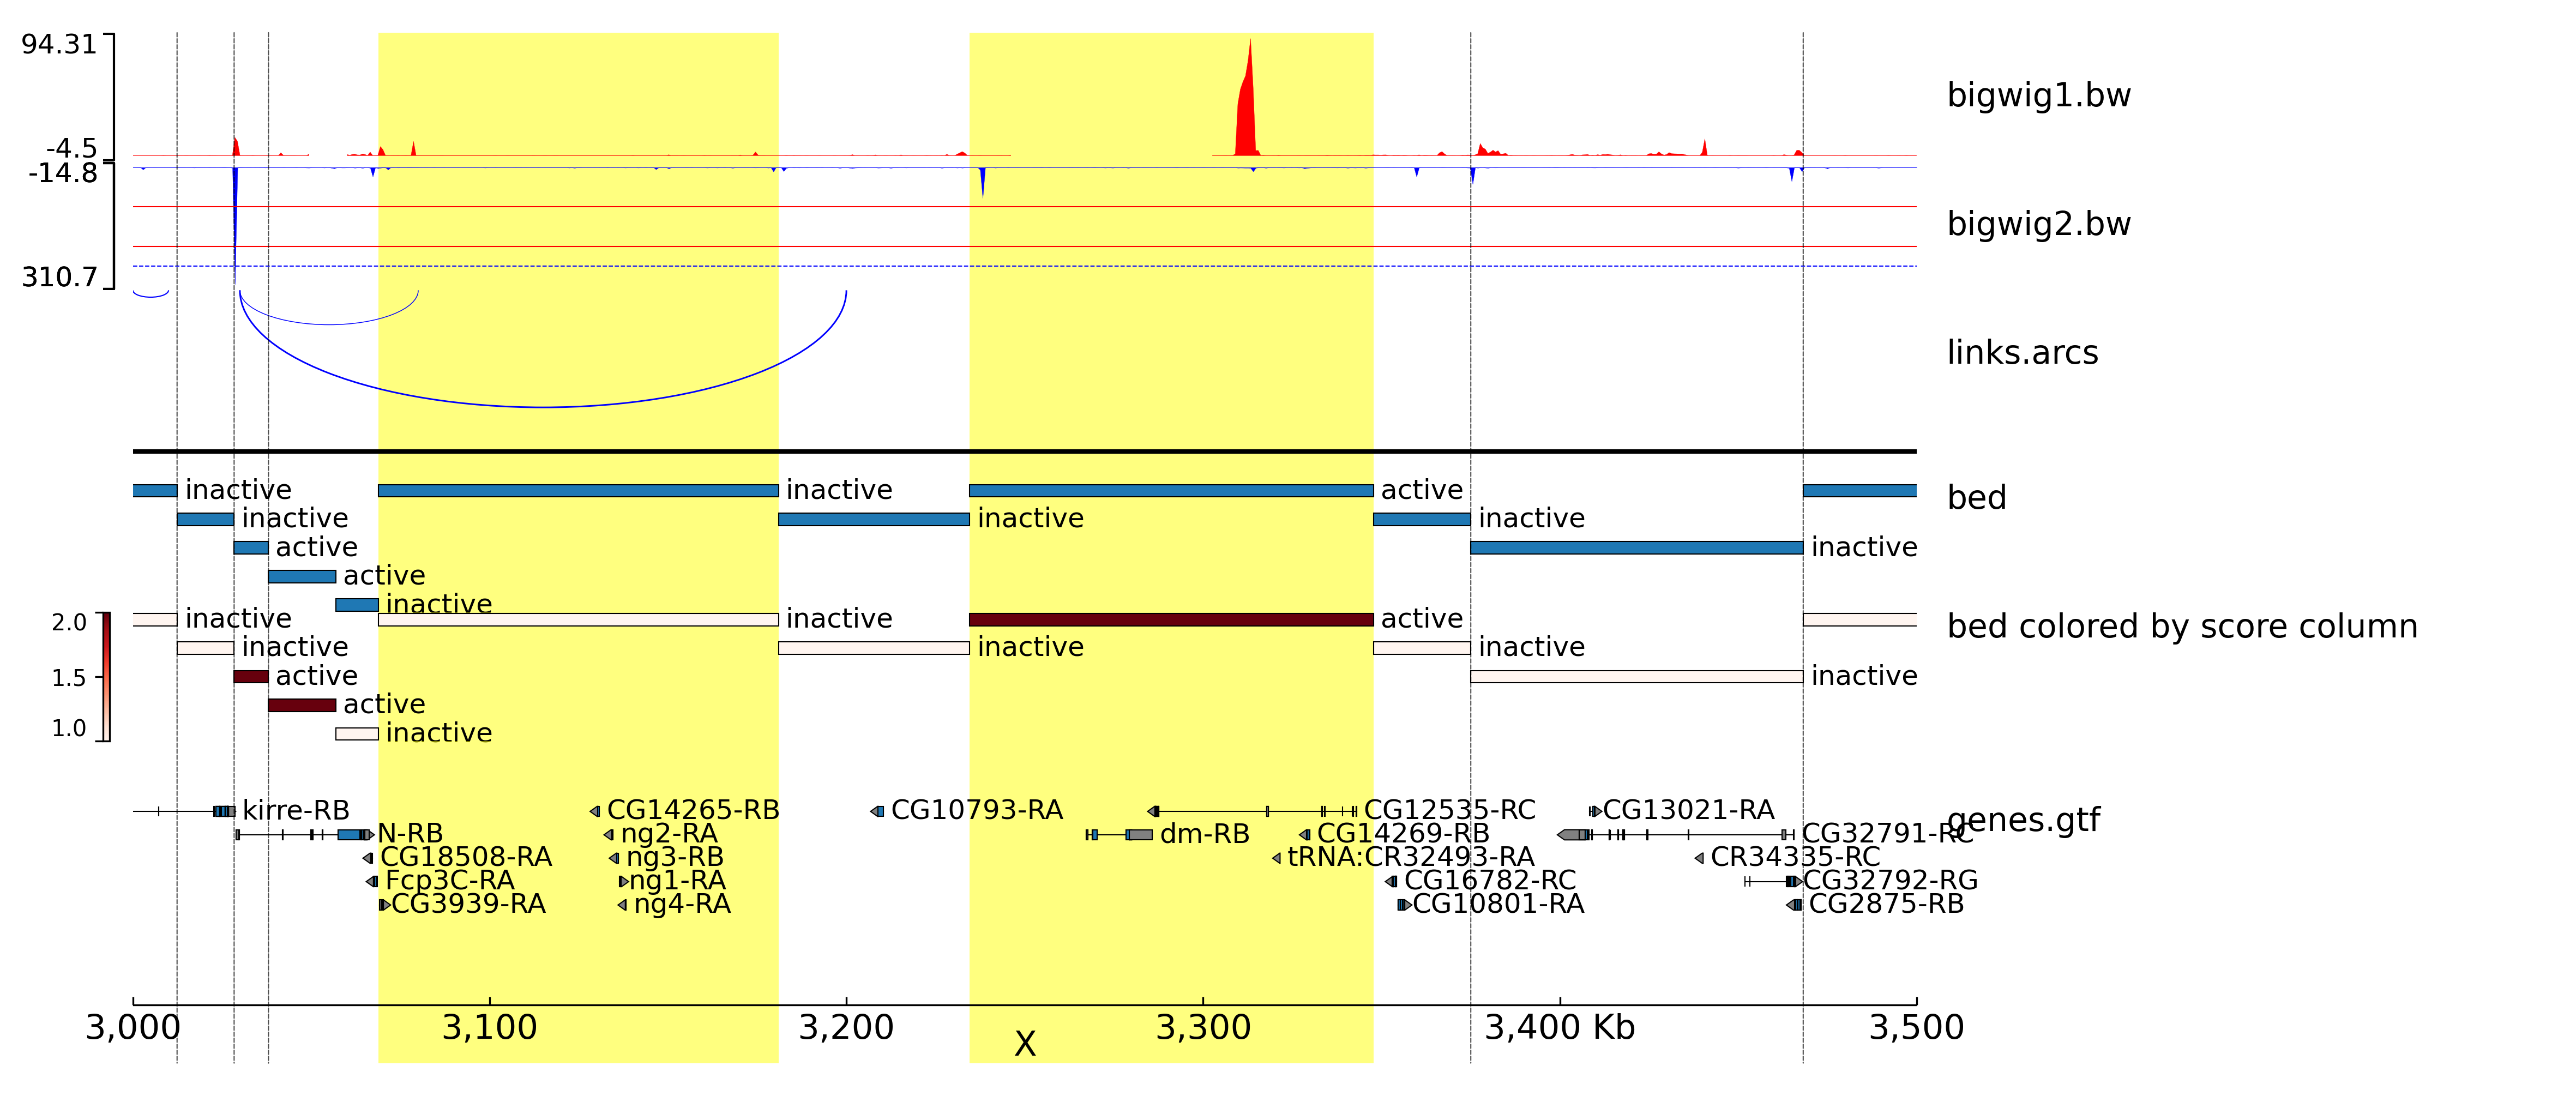
objectClass for creating a genome track plot via pyGenomeTracks by collecting different tracks and writing the .ini file.
Examples
import sctoolbox.plotting as pl

G = pl.GenomeTracks()

#Add bigwig tracks
G.add_track("data/tracks/bigwig1.bw", color="red")
G.add_track("data/tracks/bigwig2.bw", color="blue", orientation="inverted")

#Add hlines to previous bigwig track
G.add_hlines([100, 200], color="red")
G.add_hlines([250], color="blue", line_style="dashed")

#Add links
G.add_track("data/tracks/links.arcs", orientation="inverted")

#Add one line between tracks
G.add_hline()

#Add .bed-file regions
G.add_track("data/tracks/tad_classification.bed", title="bed")
G.add_track("data/tracks/tad_classification.bed", color="Reds", title="bed colored by score column")

#Add vlines and highlight
G.add_track("data/tracks/vlines.bed", file_type="vlines")
G.add_track("data/tracks/vhighlight.bed", file_type="vhighlight")

#Add a spacer
G.add_spacer()

#Add genes
G.add_track("data/tracks/genes.gtf", gene_rows=5)

#Add x-axis
G.add_spacer()
G.add_xaxis()

# Plot
G.plot(region="X:3000000-3500000", output="genometrack_X.png", trackLabelFraction=0.2)
- add_track(file: str, file_type: str | None = None, name: str | None = None, **kwargs: Any)[source]
Add a track to the GenomeTracks object.
The track will be added to the configuration file as one element, e.g. .add_track(“file1.bed”, file_type=”bed”, name=”my_bed”) will add the following to the configuration file:
`
[my_bed]
file = file1.bed
file_type = bed
`
Additional parameters are decided by <obj>.global_defaults and <obj>.type_defaults, or can be given by kwargs. All options and parameters are available at: https://pygenometracks.readthedocs.io/en/latest/content/all_tracks.html
- Parameters:
file (str) – Path to the file containing information to be plotted. Can be .bed, .bw, .gtf etc.
file_type (str, default None) – Specify the ‘file_type’ argument for pyGenomeTracks. If None, the type will be predicted from the file ending.
name (str, default None) – Name of the track. If None, the name will be estimated from the file_type e.g. ‘bigwig 1’. or ‘bed 2’. If the file_type is not available, the name will be the file path.
**kwargs (arguments) – Additional arguments to be passed to pyGenomeTracks track configuration, for example height=5 or title=”My track”.
- Raises:
ValueError – If the file_type is not valid.
- add_hlines(y_values: Iterable[int | float], overlay_previous: Literal['share-y', 'no'] = 'share-y', **kwargs: Any)[source]
Add horizontal lines to the previous plot.
- Parameters:
y_values (list of int or float) – List of y values to plot horizontal lines at.
overlay_previous (str, default "share-y") – Whether to plot the lines on the same y-axis as the previous plot (“share-y”) or on a new y-axis (“no”).
**kwargs (arguments) – Additional arguments to be passed to pyGenomeTracks track configuration, for example title=”My lines”.
- add_hline(height: int | float = 1, line_width: int | float = 2, **kwargs: Any)[source]
Add a horizontal line between tracks, not within a track.
Can be used to visually separate tracks.
- Parameters:
height (int, default 1) – Height of the track with the line in the middle.
line_width (int, default 2) – Width of the line.
**kwargs (arguments) – Additional arguments to be passed to pyGenomeTracks track configuration, for example title=”A line”.
- add_spacer(height: int | float = 1)[source]
Add a spacer between tracks.
- Parameters:
height (int, default 1) – Height of the spacer track.
- add_xaxis(height: int | float = 1, **kwargs: Any)[source]
Add the x-axis to the plot.
- Parameters:
height (int, default 1) – Height of the x-axis track.
**kwargs (arguments) – Additional arguments to be passed to pyGenomeTracks track configuration.
- plot(region: str, output: str | None = 'genometracks.png', config_file: str | None = None, title: str | None = None, show: bool = True, dpi: int = 300, **kwargs: Any)[source]
Plot the final GenomeTracks plot based on the collected tracks.
Runs pyGenomeTracks with the configuration file and the given parameters, and saves the output to the given file.
- Parameters:
region (str) – Region to plot, e.g. “chr1:1000000-2000000”.
output (str, default "genometracks.png") – Path to the output file.
config_file (str, default None) – Path to the configuration file to create. If None, a temporary file will be created in the system’s temp directory.
title (str, default None) – Title of the plot. If None, no title will be shown.
show (bool, default True) – If the function is run in a jupyter notebook, ‘show’ controls whether to show the plot at the end of the function run.
dpi (int, default 300) – DPI of the plot.
**kwargs (arguments) – Additional arguments to be passed to pyGenomeTracks, for example trackLabelFraction=0.2.
- Raises:
ValueError – If the pyGenomeTracks command fails.
velocity
Plot velocity related figures e.g. pseudo-time heatmap.
- sctoolbox.plotting.velocity.pseudotime_heatmap(adata: AnnData, genes: list[str], sortby: str | None = None, layer: str | None = None, figsize: tuple[int | float, int | float] | None = None, shrink_cbar: int | float = 0.5, title: str | None = None, save: str | None = None, **kwargs: Any) Axes[source]
Plot heatmap of genes along pseudotime sorted by ‘sortby’ column in adata.obs.
- Parameters:
adata (sc.AnnData) – Anndata object
genes (list[str]) – List of genes for heatmap.
sortby (Optional[str], default None) – Sort genes by condition
layer (Optional[str], default None) – Use different layer of anndata object.
figsize (Optional[Tuple[int | float, int | float]], default None) – Tuple of integers setting the heatmap figsize.
shrink_cbar (int | float, default 0.5) – Shrink color bar by set ratio.
title (Optional[str], default None) – Set title for plot.
save (Optional[str], default None) – Path and name of file to be saved.
**kwargs (Any) – Additional arguments passed to seaborn.heatmap.
- Returns:
ax – Axes object containing the plot.
- Return type:
matplotlib.axes.Axes
general
General plotting functions for sctoolbox, e.g. general plots for wrappers, and saving and adding titles to figures.
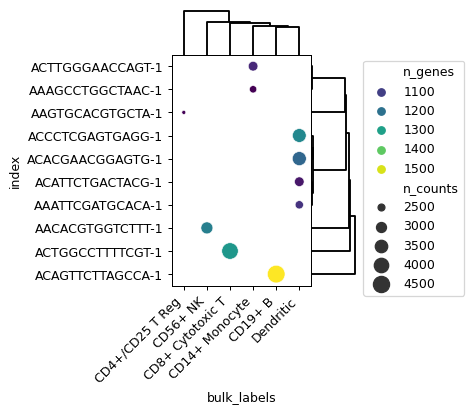
- sctoolbox.plotting.general.clustermap_dotplot(table: DataFrame, x: str, y: str, size: str, hue: str, cluster_on: Literal['hue', 'size'] = 'hue', fillna: float | int = 0, title: str | None = None, figsize: tuple[int | float, int | float] | None = None, dend_height: float | int = 2, dend_width: float | int = 2, palette: str = 'vlag', x_rot: int = 45, show_grid: bool = False, save: str | None = None, **kwargs: Any) list[source]
Plot a heatmap with dots (instead of squares), which can contain the dimension of “size”.
- Parameters:
table (pd.DataFrame) – Table in long-format. Has to have at least four columns as given by x, y, size and hue.
x (str) – Column in table to plot on the x-axis.
y (str) – Column in table to plot on the y-axis.
size (str) – Column in table to use for the size of the dots.
hue (str) – Column in table to use for the color of the dots.
cluster_on (Literal["hue", "size"], default hue) – Decide which values to use for creating the dendrograms. Either “hue” or “size”.
fillna (float | int, default 0) – Replace NaN with given value.
title (Optional[str], default None) – Title of the dotplot.
figsize (Optional[Tuple[int | float, int | float]], default None) – Figure size in inches. Default is estimated from the number of rows/columns (ncols/3, nrows/3).
dend_height (float | int, default 2) – Height of the x-axis dendrogram in counts of row elements, e.g. 2 represents a height of 2 rows in the dotplot.
dend_width (float | int, default 2) – Width of the y-axis dendrogram in counts of column elements, e.g. 2 represents a width of 2 columns in the dotplot.
palette (str, default vlag) – Color palette for hue colors.
x_rot (int, default 45) – Rotation of xticklabels in degrees.
show_grid (bool, default False) – Show grid behind dots in plot.
save (Optional[str], default None) – Save the figure to this path.
**kwargs (Any) – Additional arguments to pass to seaborn.scatterplot.
- Returns:
List of matplotlib.axes.Axes objects containing the dotplot and the dendrogram(s).
- Return type:
list
Examples
table = adata.obs.reset_index()[:10]
pl.clustermap_dotplot(
    table=table,
    x="bulk_labels",
    y="index",
    hue="n_genes",
    size="n_counts",
    palette="viridis"
)
- sctoolbox.plotting.general.bidirectional_barplot(df: DataFrame, title: str | None = None, colors: dict[str, str] | None = None, figsize: tuple[int | float, int | float] | None = None, save: str | None = None) Axes[source]
Plot a bidirectional barplot.
A vertical barplot where each position has one bar going left and one going right (bidirectional).
- Parameters:
df (pd.DataFrame) –
- Dataframe with the following mandatory column names:
left_label
right_label
left_value
right_value
title (Optional[str], default None) – Title of the plot.
colors (Optional[dict[str, str]], default None) – Dictionary with label names as keys and colors as values.
figsize (Optional[Tuple[int | float, int | float]], default None) – Figure size.
save (Optional[str], default None) – If given, the figure will be saved to this path.
- Returns:
Axes containing the plot.
- Return type:
matplotlib.axes.Axes
- Raises:
KeyError – If df does not contain the required columns.
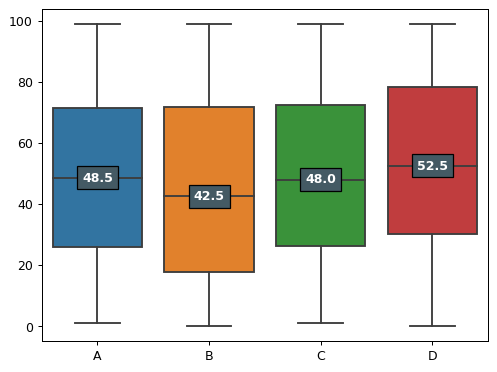
- sctoolbox.plotting.general.boxplot(dt: DataFrame, show_median: bool = True, ax: Axes | None = None, **kwargs: Any) Axes[source]
Generate one plot containing one box per column. The median value is shown.
- Parameters:
dt (pd.DataFrame) – pandas datafame containing numerical values in every column.
show_median (boolean, default True) – If True show median value as small box inside the boxplot.
ax (Optional[matplotlib.axes.Axes], default None) – Axes object to plot on. If None, a new figure is created.
**kwargs (Any) – Additional arguments to pass to seaborn.boxplot.
- Returns:
containing boxplot for every column.
- Return type:
matplotlib.axes.Axes
Examples
import pandas as pd
dt = pd.DataFrame(np.random.randint(0,100,size=(100, 4)), columns=list('ABCD'))
pl.boxplot(dt, show_median=True, ax=None)
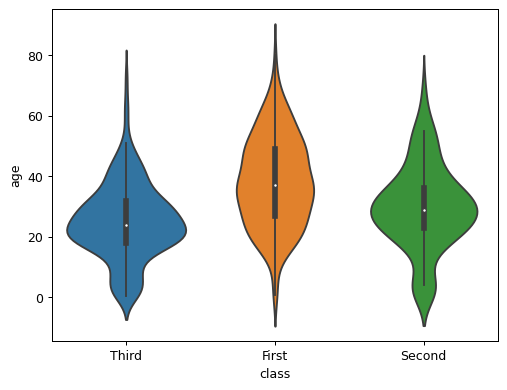
- sctoolbox.plotting.general.violinplot(table: DataFrame, y: str, color_by: str | None = None, hlines: float | int | list[float | int] | dict[str, float | int | list[float | int]] | None = None, colors: list[str] | None = None, ax: Axes | None = None, title: str | None = None, ylabel: bool = True, **kwargs: Any) Axes[source]
Plot a violinplot with optional horizontal lines for each violin.
- Parameters:
table (pd.DataFrame) – Values to create the violins from.
y (str) – Column name of table. Values that will be shown on y-axis.
color_by (Optional[str], default None) – Column name of table. Used to color group violins.
hlines (Optional[Union[float | int, list[float | int],) – dict[str, Union[float | int, list[float | int]]]]], default None Define horizontal lines for each violin.
colors (Optional[list[str]], default None) – List of colors to use for violins.
ax (Optional[matplotlib.axes.Axes], default None) – Axes object to draw the plot on. Otherwise use current axes.
title (Optional[str], default None) – Title of the plot.
ylabel (bool | str, default True) – Boolean if ylabel should be shown. Or str for custom ylabel.
**kwargs (Any) – Additional arguments to pass to seaborn.violinplot.
- Returns:
Object containing the violinplot.
- Return type:
matplotlib.axes.Axes
- Raises:
ValueError – If y or color_by is not a column name of table. Or if hlines is not a number or list of numbers for color_by=None.
Examples
import seaborn as sns
table = sns.load_dataset("titanic")
pl.violinplot(table, "age", color_by="class", hlines=None, colors=None, ax=None, title=None, ylabel=True)
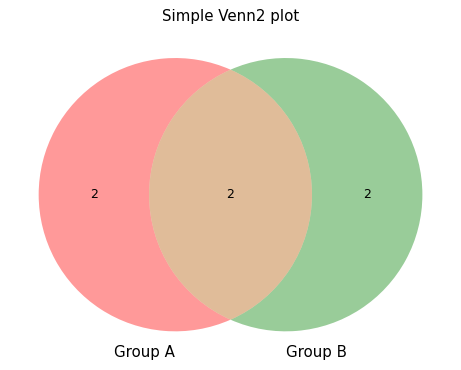
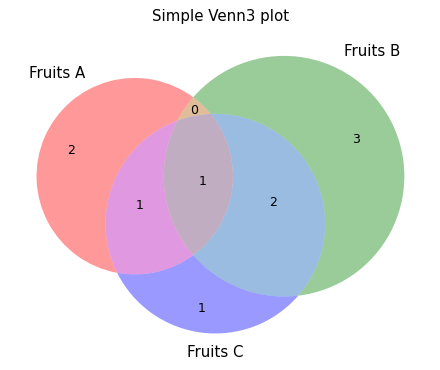
- sctoolbox.plotting.general.plot_venn(groups_dict: dict[str, list[Any]], title: str | None = None, save: str | None = None, **kwargs: Any) None[source]
Plot a Venn diagram from a dictionary of 2-3 groups of lists.
- Parameters:
groups_dict (dict[str, list[Any]]) – A dictionary where the keys are group names (strings) and the values are lists of items belonging to that group (e.g. {‘Group A’: [‘A’, ‘B’, ‘C’], …}).
title (Optional[str], default None) – Title of the plot.
save (Optional[str], default None) – Filename to save the plot to.
**kwargs (Any) – Additional arguments to pass to matplotlib_venn.venn2 or matplotlib_venn.venn3.
- Raises:
ValueError – If number of groups in groups_dict is not 2 or 3.
Examples
venn2_example = { 'Group A': [1, 2, 3, 4],
                  'Group B': [3, 4, 5, 6]
                }
pl.plot_venn(venn2_example, "Simple Venn2 plot")
venn3_example = { 'Fruits A': ['Lemon', 'Orange', 'Blueberry', 'Grapefruit'],
                  'Fruits B': ['Pineapple', 'Mango', 'Banana', 'Papaya', 'Blueberry', 'Strawberry'],
                  'Fruits C': ['Strawberry', 'Blueberry', 'Raspberry', 'Orange', 'Mango']
                }
pl.plot_venn(venn3_example, "Simple Venn3 plot")
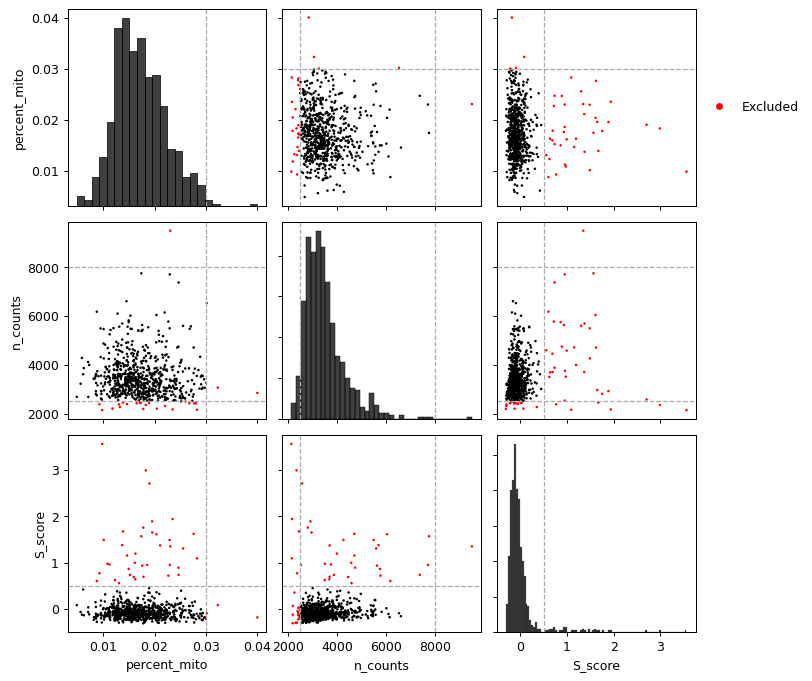
- sctoolbox.plotting.general.pairwise_scatter(table: DataFrame, columns: list[str], thresholds: dict[str, dict[Literal['min', 'max'], int | float]] | None = None, save: str | None = None, **kwargs: Any) ndarray[source]
Plot a grid of scatterplot comparing column values pairwise.
If thresholds are given, lines are drawn for each threshold and points outside of the thresholds are colored red.
- Parameters:
table (pd.DataFrame) – Dataframe containing the data to plot.
columns (list[str]) – List of column names in table to plot.
thresholds (Optional[dict[str, dict[Literal["min", "max"], int | float]]], default None) – Dictionary containing thresholds for each column. Keys are column names and values are dictionaries with keys “min” and “max”.
save (Optional[str], default None) – If given, the figure will be saved to this path.
**kwargs (Any) – Additional arguments to pass to matplotlib.axes.Axes.scatter.
- Returns:
Array of matplotlib.axes.Axes objects.
- Return type:
np.ndarray
- Raises:
ValueError –
If columns contains less than two columns. 2. If one of the given columns is not a table column
Examples
columns = ["percent_mito", "n_counts", "S_score"]

thresholds = {"n_counts": {"min": 2500, "max": 8000},
              "percent_mito": {"max": 0.03},
              "S_score": {"max": 0.5}}

pl.pairwise_scatter(adata.obs, columns, thresholds=thresholds)
